Record ‘Goods’ Trade Deficit & Deterioration in ‘Services’ Surplus
In discussions about gross domestic product (GDP), foreign trade receives the attention it deserves in Canada, but it’s undervalued in the U.S. The reason undoubtedly has to do with the shares of GDP contributed by exports in the two countries.
In Canada, total exports as a share of GDP in 2019 (i.e., the last full year before the coronavirus lull) were 32%, or nearly one-third, with ‘goods’ at 26% and ‘services’ at 6%. In the U.S. in 2019, the export slice of GDP was considerably lower, 12%, with ‘goods’ at 8% and ‘services’ at 4%. But 12% of GDP is nothing to scoff at; it’s a formidable chunk, nonetheless.
Furthermore, one of America’s biggest problems at present concerns supply shortages which, in turn, are often tied to the logistical difficulties of moving cargo in and out of ports.
The U.S. has been running a foreign trade deficit for as far back as anyone can remember. Specifically, there’s been a deficit in ‘goods’ trade (a.k.a., the merchandise trade balance) that has been much larger than the surplus in ‘services’ trade.
The total or net deficit became extremely large in the several years preceding the 2008-09 recession, then it quietened down for about ten years. In 2021, however, it has roared back.
In two of the last three months, the total U.S. trade deficit has worsened to new all-time extremes. The shortfall in ‘goods’ trade has been exceeding -$1 trillion dollars. Nor is help coming from a ‘services’ surplus to the same degree as in the past. Sad to say, the ‘services’ surplus has been slipping.
Perhaps when people pick up the pace of their international travel post-pandemic, the ‘services’ balance will turn more positive once again. But this will depend on more tourism and business travelers wishing to visit America than a tendency in the opposite direction. In the ‘services’ trade statistics, the hotel stays of foreigners while sojourning in America are counted as exports; the accommodation expenditures of U.S. citizens while on a jaunt in Europe or elsewhere abroad are judged to be imports.
If the U.S. foreign trade balance continues to deteriorate, it will soon rise higher among agenda items demanding scrutiny. Under current circumstances, it will be hard to argue for the removal of tariff barriers. Nor should there be an expectation the U.S. dollar will easily maintain strength. A weaker currency implies upward pressure on interest rates.
Construction Opportunities from Foreign Trade Initiatives
For the construction industry, there are several intriguing and potentially encouraging aspects to the U.S. foreign trade picture. A move away from the offshoring of work, as one answer to the international breakdown in supply chains, will mean the building of more production capacity and more inventory storage room at home.
The global agreement, or at least one reached by 140 countries, to install a minimum corporate tax rate will dampen the incentive for major American companies to set up operations in other jurisdictions. The practice of shopping around among nations for tax bargains will be suppressed. Again, this will be a spur to domestic capital spending and expansion plans, with export markets factoring into sales targets.
Finally, there’s a huge opportunity for the construction of export-oriented energy-related facilities in petrochemicals, fertilizers, and LNG product due to the outsized discrepancy in the cost of natural gas in North America ($6 USD/mcf) compared with Europe ($30 USD/mcf) and many other parts of the world, notably China and Japan.
Graph 1: United States’ Foreign Trade: Goods and Services Balance − August 2021
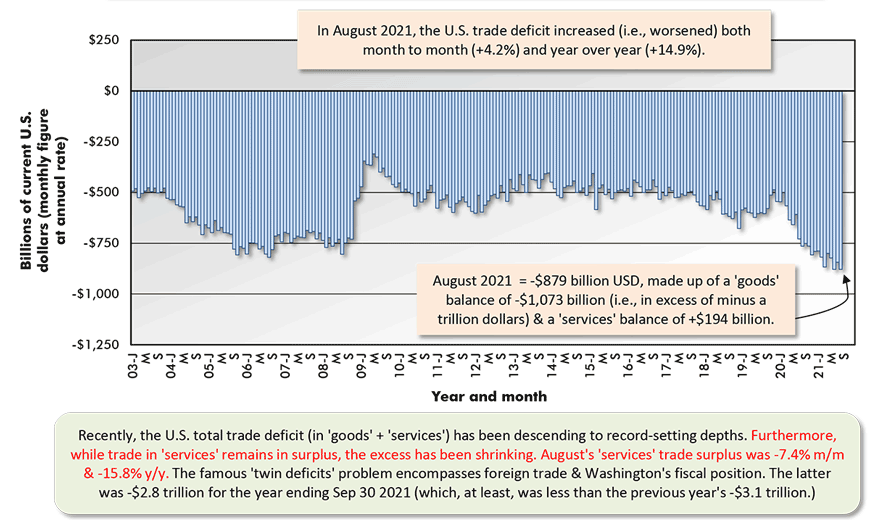
The last data point is for August 2021.
Based on seasonally adjusted monthly figures, projected at an annual rate.
Data source: Bureau of Economic Analysis (BEA).
Chart: ConstructConnect.
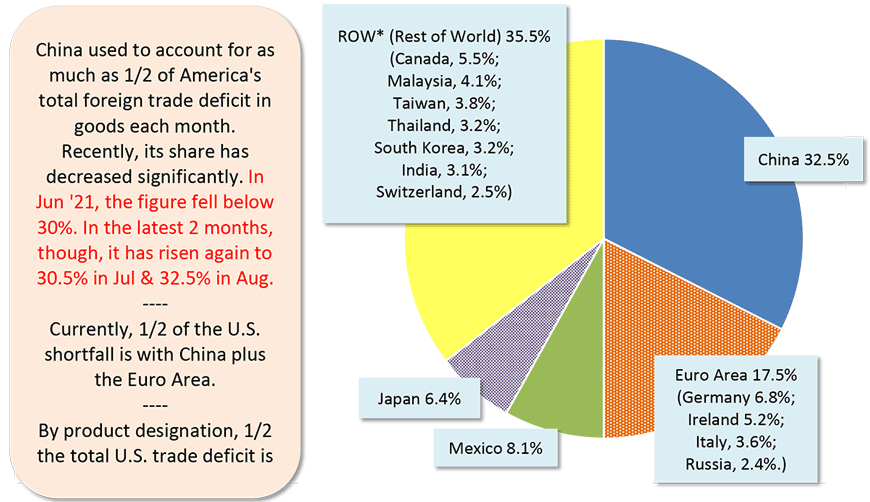
Graph 2: Geographic Sources of U.S. Total Foreign Trade Deficit in Goods – August 2021
Data source: U.S. Census Bureau and Bureau of Economic Analysis (BEA).
Chart: ConstructConnect.
Table 1: 12 of the Top Suppliers of U.S. Oil Imports
Year to Date (YTD) August, 2021
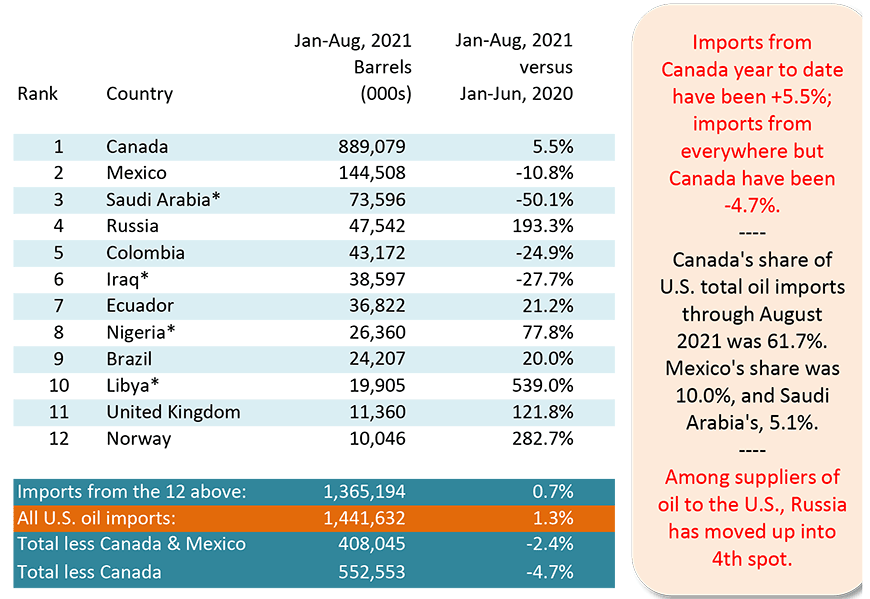
* OPEC nations.
Data source: Bureau of Economic Analysis (BEA).
Chart: ConstructConnect.
Graph 3: Foreign Sources of U.S. Imported Oil
% of Total Barrels – Jan-Aug 2021
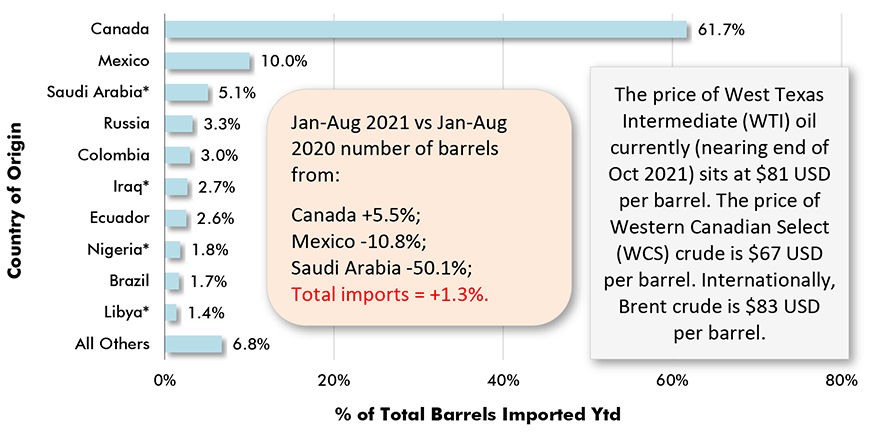
* Asterisk indicates country among OPEC members. Ecuador left OPEC in January 2020.
Data source: Census Bureau & Bureau of Economic Analysis (BEA).
Chart: ConstructConnect.
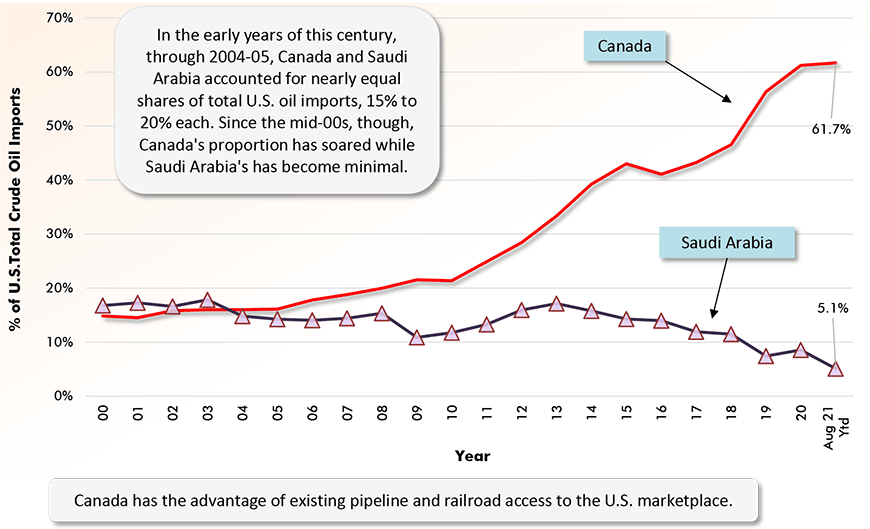
Graph 4: Shares of U.S. Total Oil Imports (Barrels)
Sourced from Canada and Saudi Arabia
Data sources: Census Bureau, Bureau of Economic Analysis (BEA) & Energy Information Administration (EIA)
Chart: ConstructConnect.
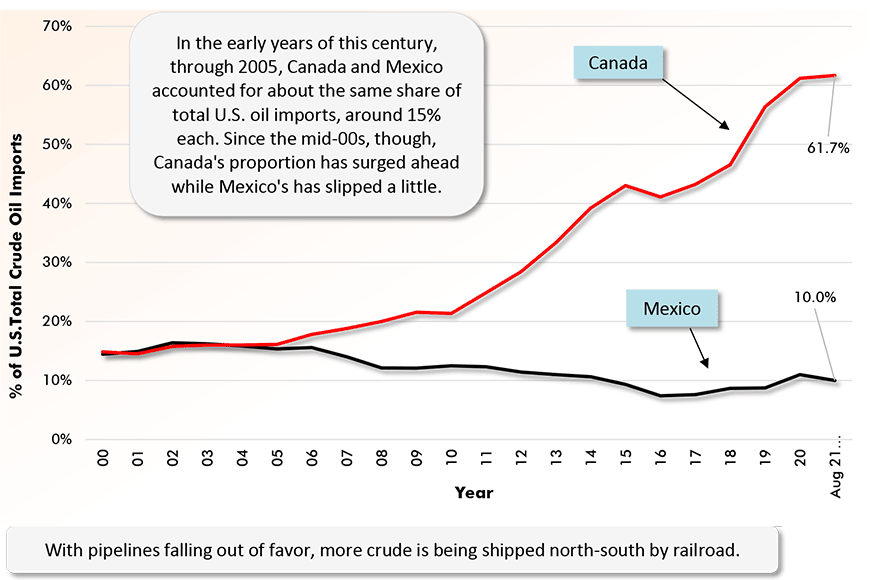
Graph 4: Shares of U.S. Total Oil Imports (Barrels)
Sourced from Canada and Saudi Mexico
Data sources: Census Bureau, Bureau of Economic Analysis (BEA) & Energy Information Administration (EIA)
Chart: ConstructConnect.
Pick-up in Commodity Prices a Boon to Canada
Canada’s foreign trade is taking a turn for the better. In six of the eight months of 2021, Canada’s ‘goods’ trade balance has been positive. It’s been the nation’s best performance on the trade front since 2008. It should be added, however, that the positive numbers this year are still well below what was realized in most months prior to 2008-2009’s Great Recession.
The pick-up in commodity prices has been a boon for Canadian export sales. West Texas Intermediate (WTI) oil is above $80 USD per barrel, helping to lift the price of Western Canadian Select (WCS) oil to $67 USD per barrel.
There have been demand and price increases for a host of other commodities that Canada supplies to the world. Approximately 60% of Canada’s total export sales derive in primary or secondary form from resources.
At the end of this article is a string of graphs showing the big trade advantages Canada enjoys, exports minus imports, in a dozen markets centered on raw materials.
For Canada, a feature of the foreign trade-construction connection over the past decade (and opposite to the full-steam ahead approach in the period of the 00s) has been an absence of mega projects in the resource sector. After a long hiatus, there are prospects of a turnaround, dependent on regulatory approvals of course.
Graph 6: Canada’s Foreign Trade: The Merchandise Trade Balance − August 2021
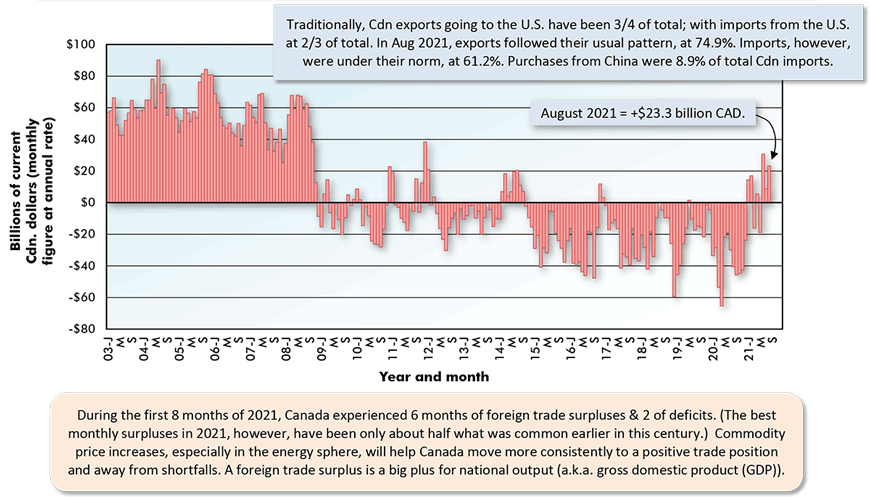
The last data point is for August 2021.
Based on seasonally adjusted monthly figures, projected at an annual rate.
Data source: Statistics Canada.
Chart: ConstructConnect.
Graph 7: Provincial Export Sales, Jan-Aug, 2021
Ranked by $ Volume (Also Showing YTD% Changes – i.e., vs Jan-Aug, 2020)
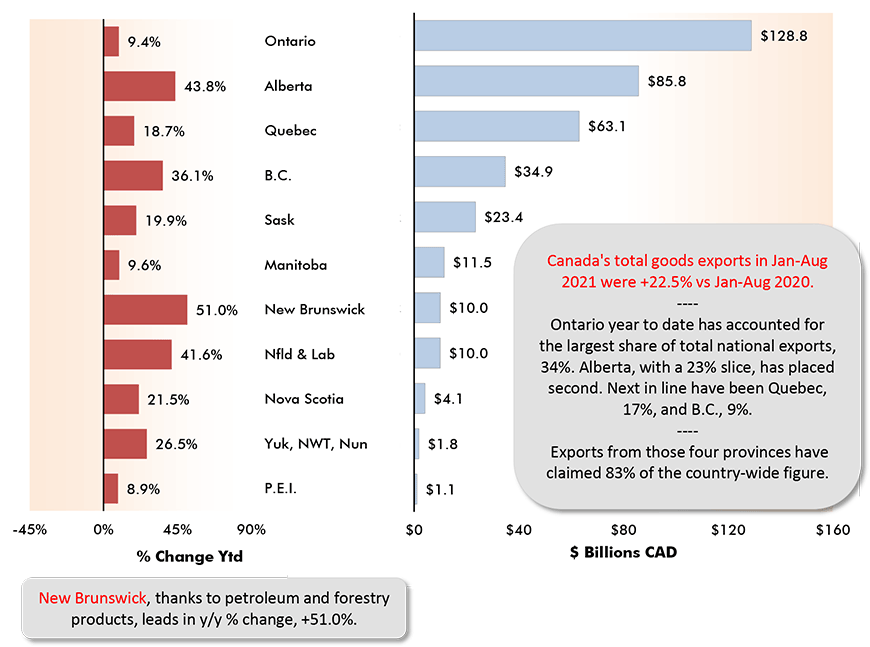
Data source: Statistics Canada.
Chart: ConstructConnect.
Graph 8: Canada’s Key Export Product Sales by Province
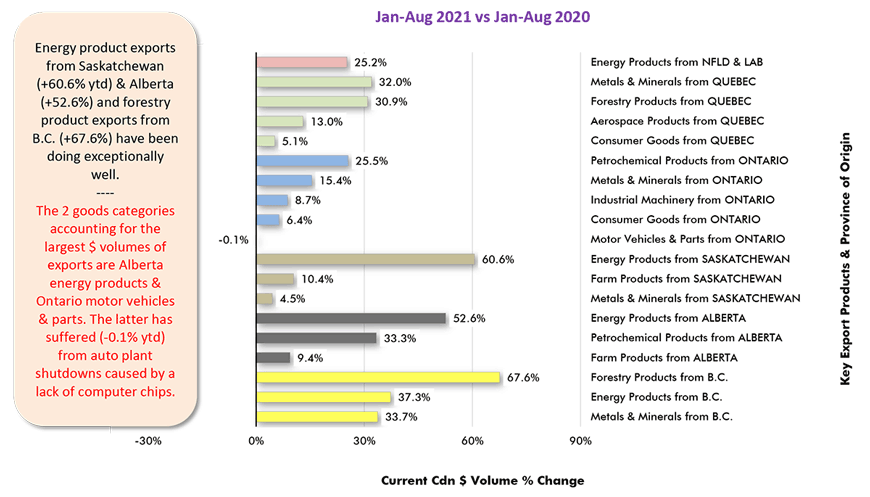
Data source: Statistics Canada Table 12-10-0119-01.
Chart: ConstructConnect.
Graph 9: Canada’s Foreign Trade in Crude Oil and Bitumen
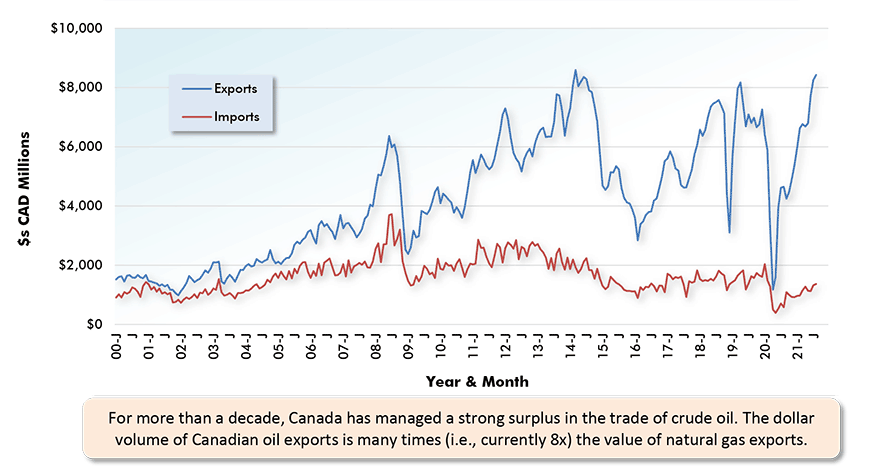
Latest data points are for August 2021.
Data source: Statistics Canada.
Chart: ConstructConnect.
Graph 10: Canada’s Foreign Trade in Natural Gas
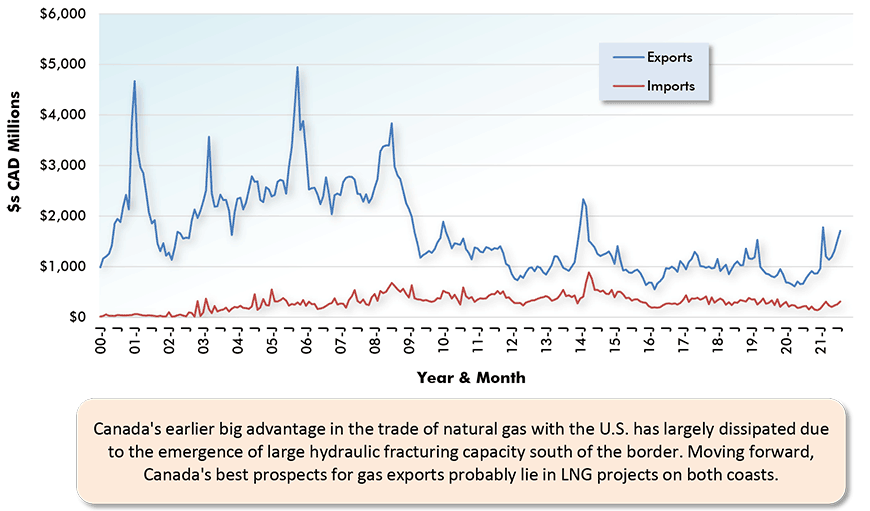
Latest data points are for August 2021.
Data source: Statistics Canada.
Chart: ConstructConnect.
Graph 11: Canada’s Foreign Trade in Refined Petroleum Product
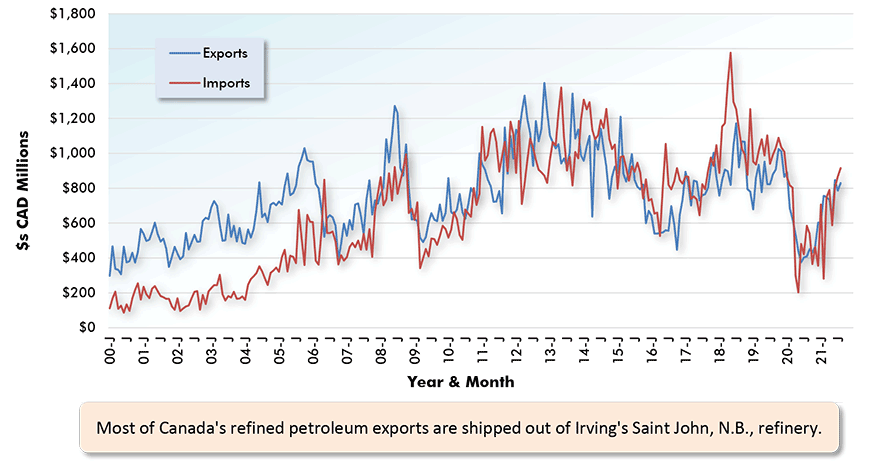
Latest data points are for August 2021.
Data source: Statistics Canada.
Chart: ConstructConnect.
Graph 12: Canada’s Foreign Trade in Electricity
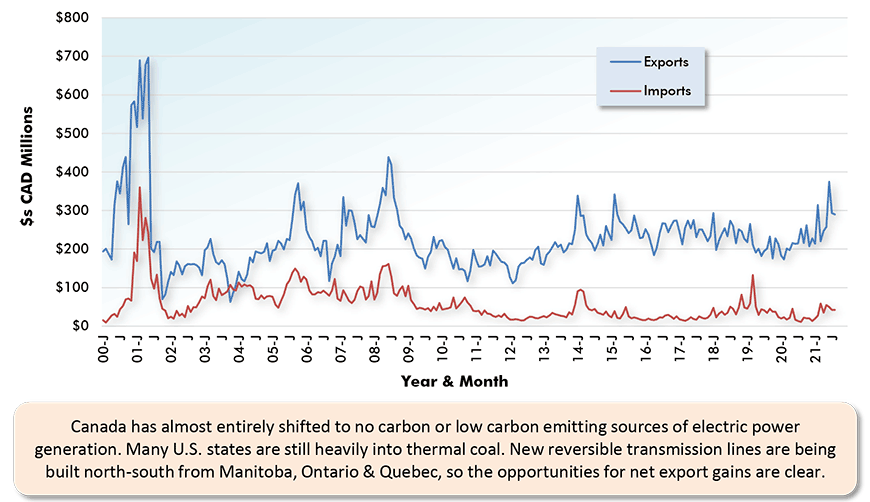
Latest data points are for August 2021.
Data source: Statistics Canada.
Chart: ConstructConnect.
Graph 13: Canada’s Foreign Trade in Coal
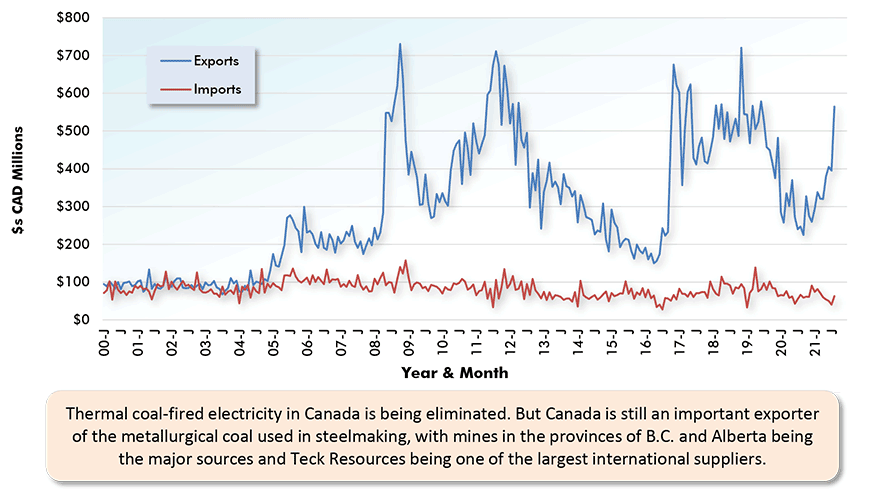
Latest data points are for August 2021.
Data source: Statistics Canada.
Chart: ConstructConnect.
Graph 14: Canada’s Foreign Trade in Iron Ore
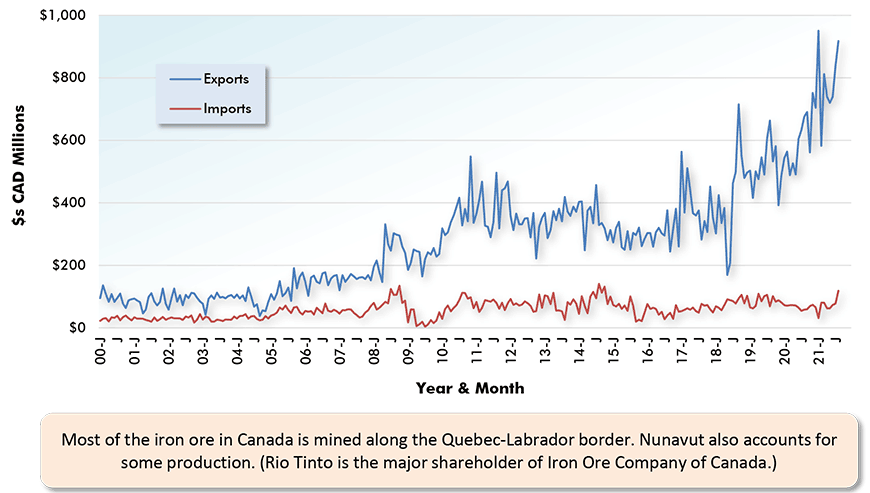
Latest data points are for August 2021.
Data source: Statistics Canada.
Chart: ConstructConnect.
Graph 15: Canada’s Foreign Trade in Copper
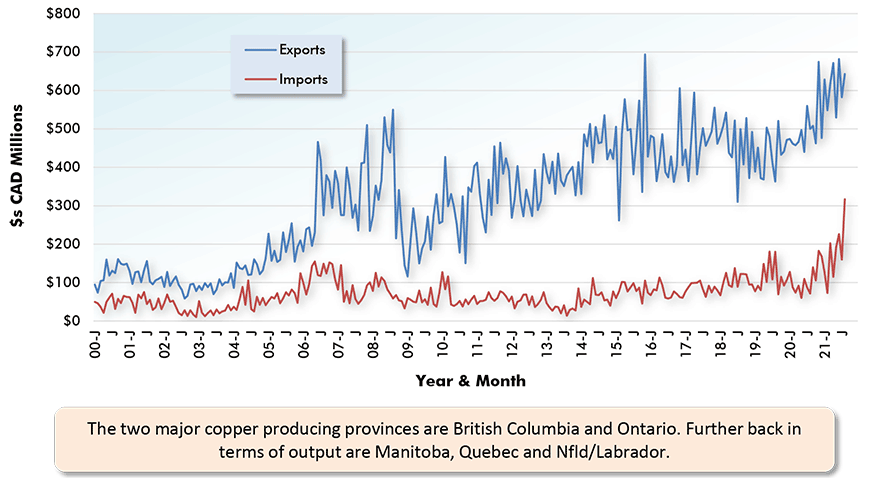
Latest data points are for August 2021.
Data source: Statistics Canada.
Chart: ConstructConnect.
Graph 16: Canada’s Foreign Trade in Nickel
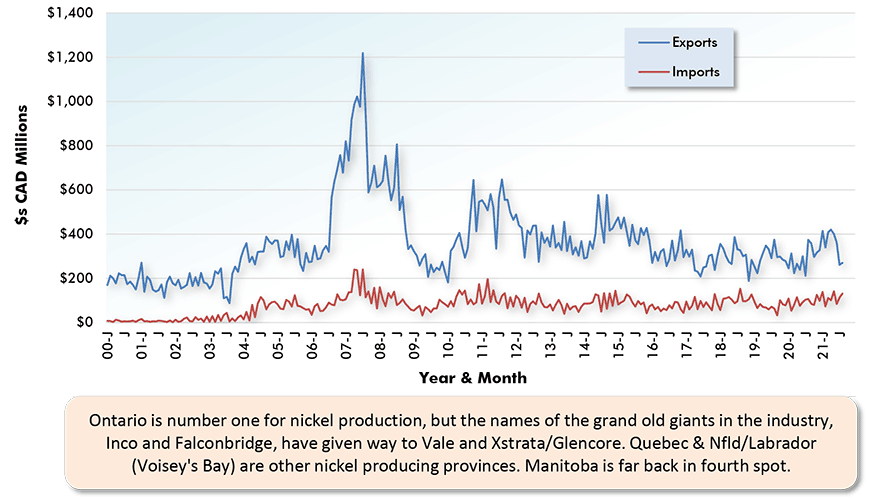
Latest data points are for August 2021.
Data source: Statistics Canada.
Chart: ConstructConnect.
Graph 17: Canada’s Foreign Trade in Gold, Silver & Platinum
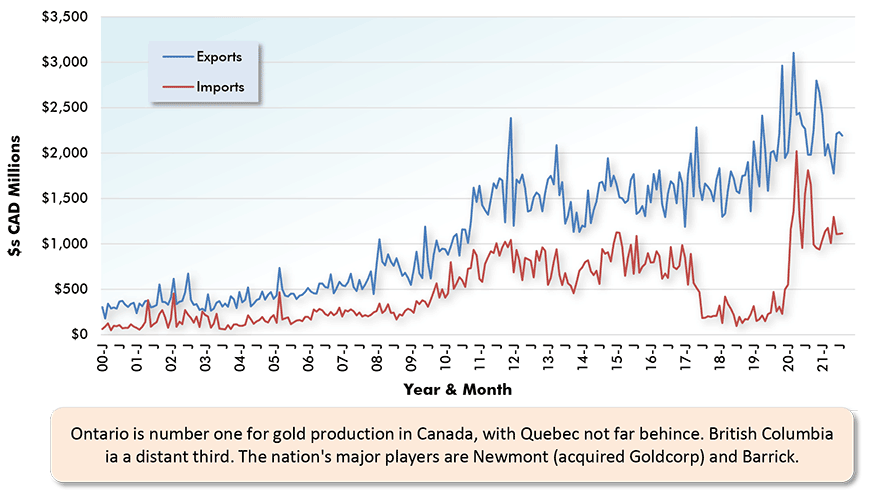
Latest data points are for August 2021.
Data source: Statistics Canada.
Chart: ConstructConnect.
Graph 18: Canada’s Foreign Trade in Potash
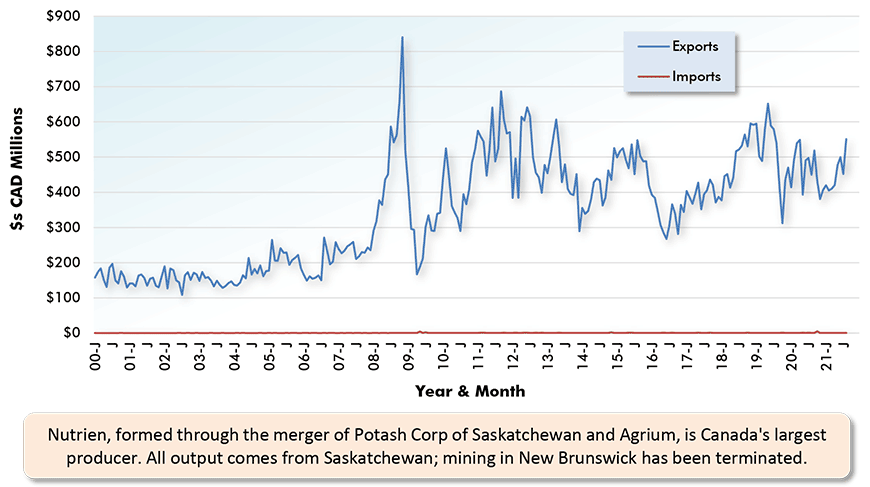
Latest data points are for August 2021.
Data source: Statistics Canada.
Chart: ConstructConnect.
Graph 19: Canada’s Foreign Trade in Aluminum
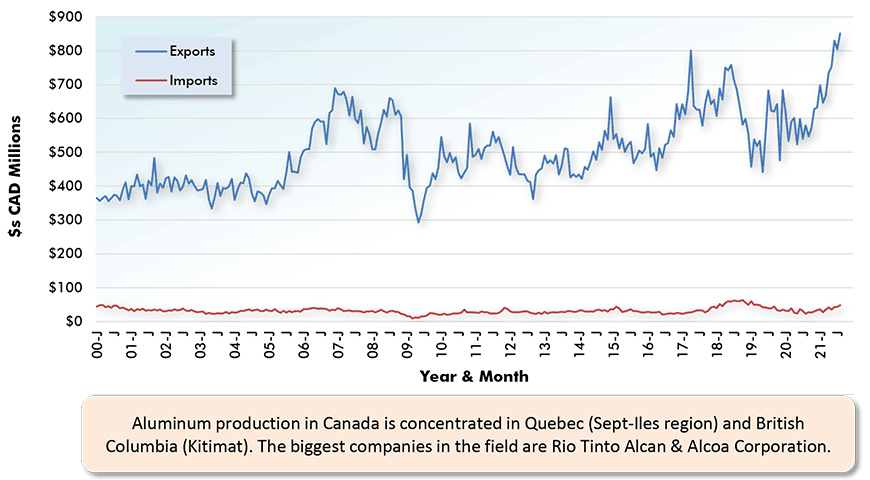
Latest data points are for August 2021.
Data source: Statistics Canada.
Chart: ConstructConnect.
Graph 20: Canada’s Foreign Trade in Lumber & Other Sawmill Products
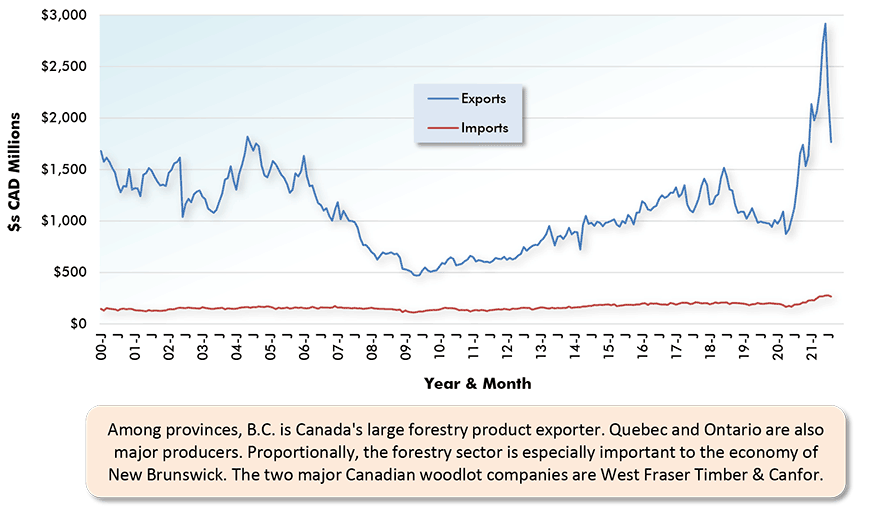
Latest data points are for August 2021.
Data source: Statistics Canada.
Chart: ConstructConnect.


Recent Comments