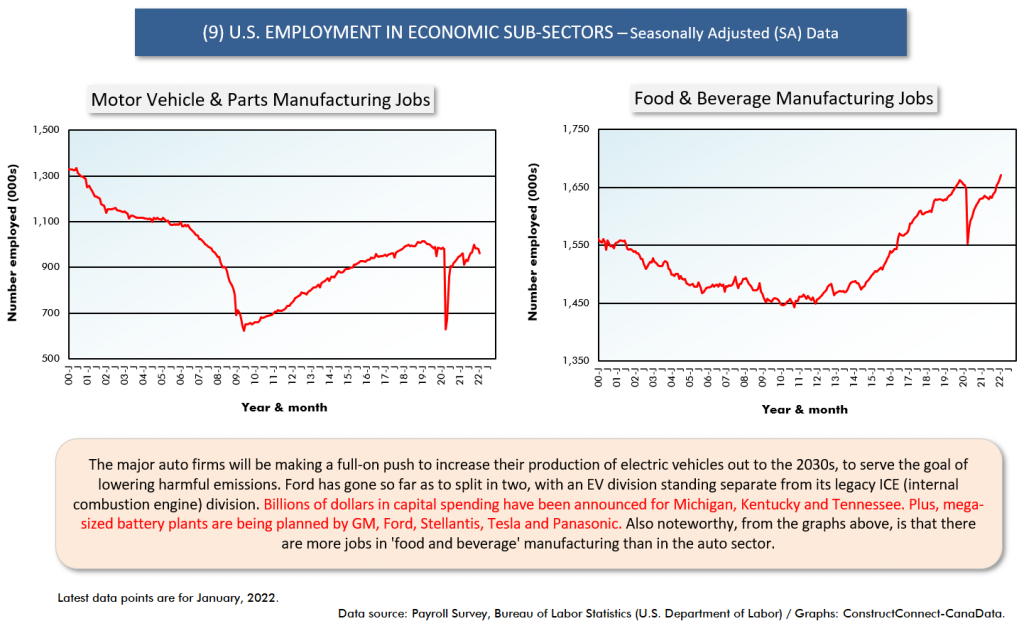
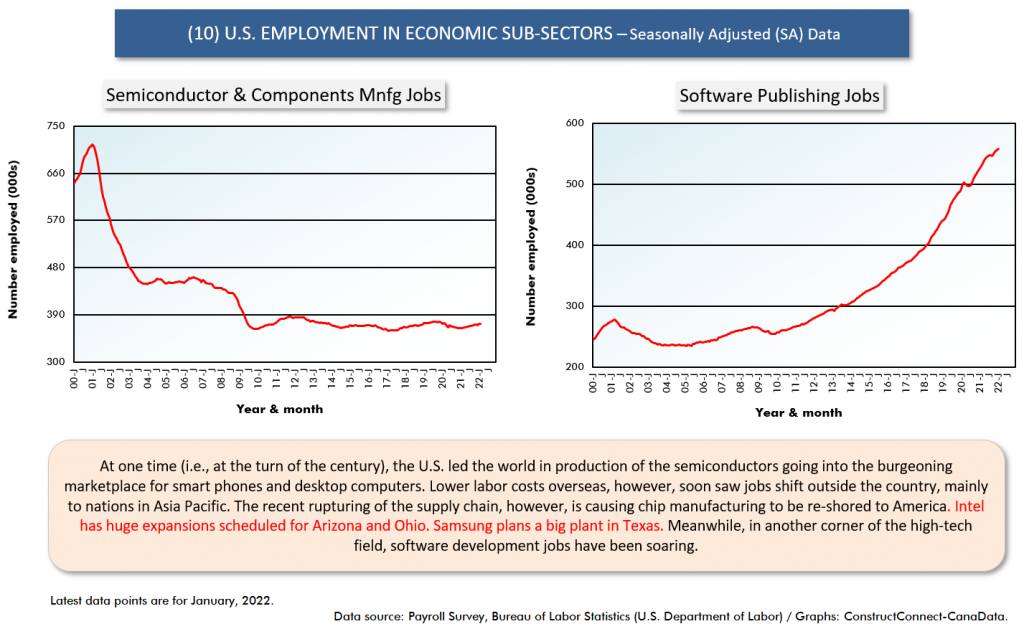
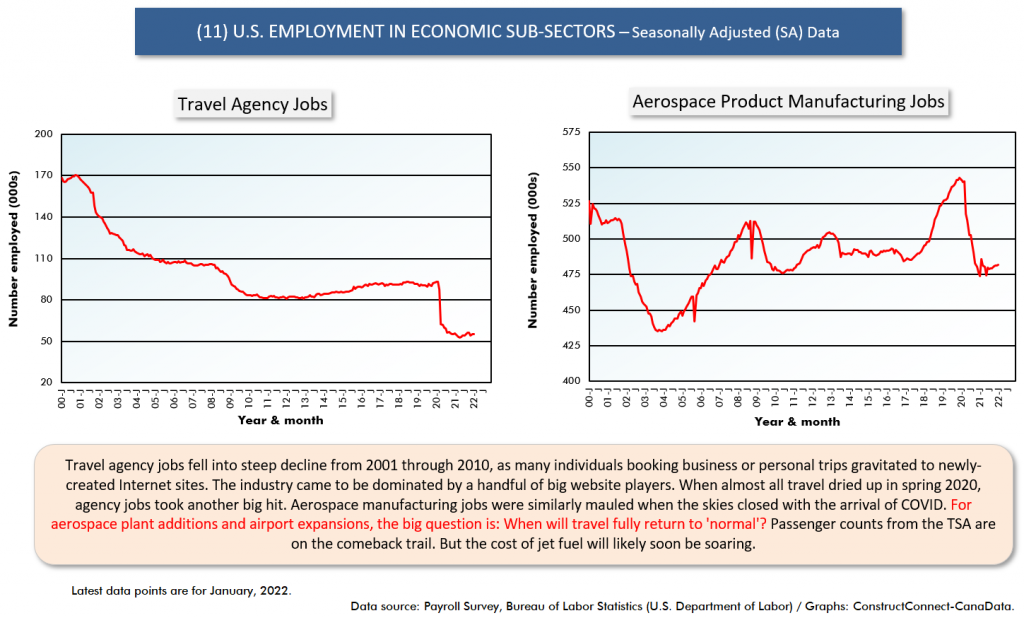
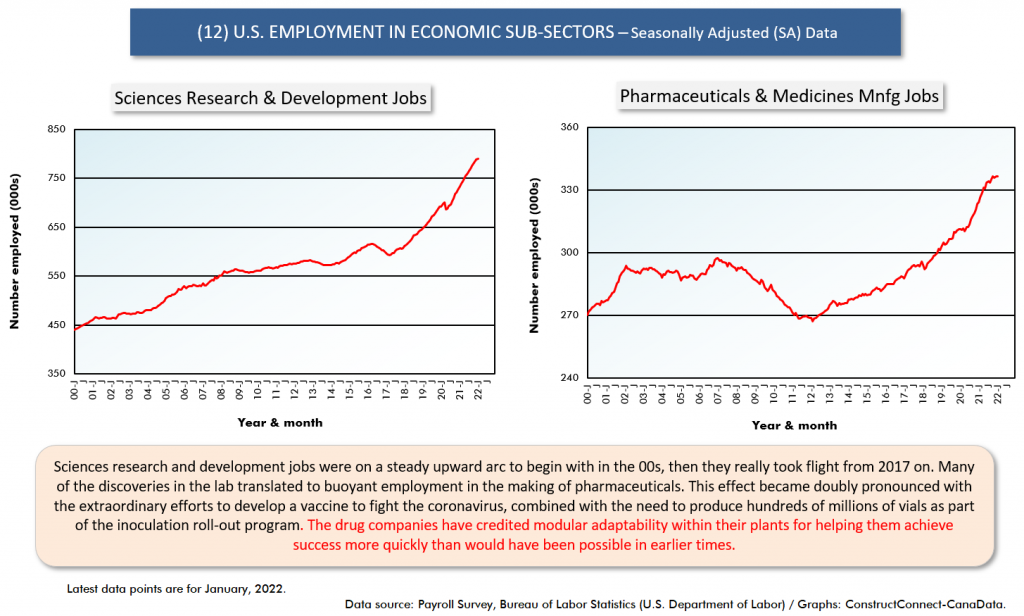
This article is an exploration of where jobs are sprouting in the U.S. economy versus where they are withering. The analysis is carried forward by means of cluster charts comprised of two graphs each and a text box.

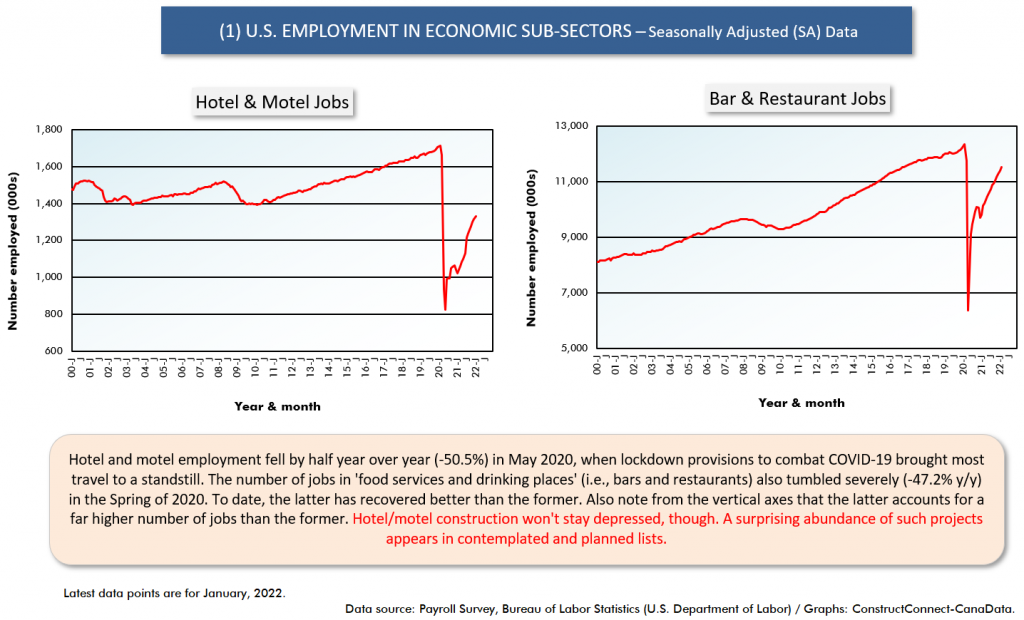
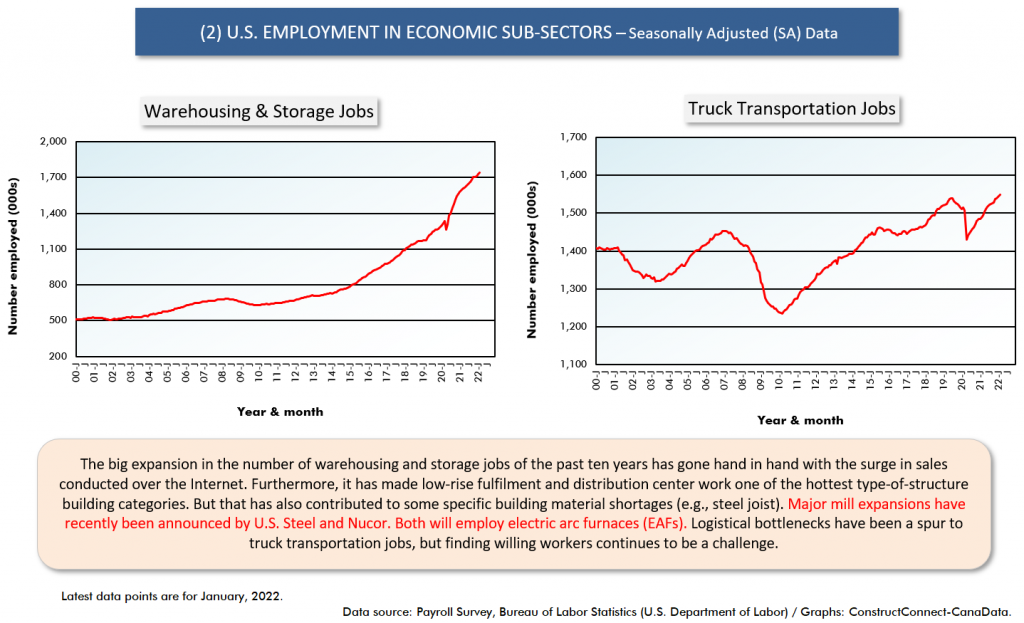
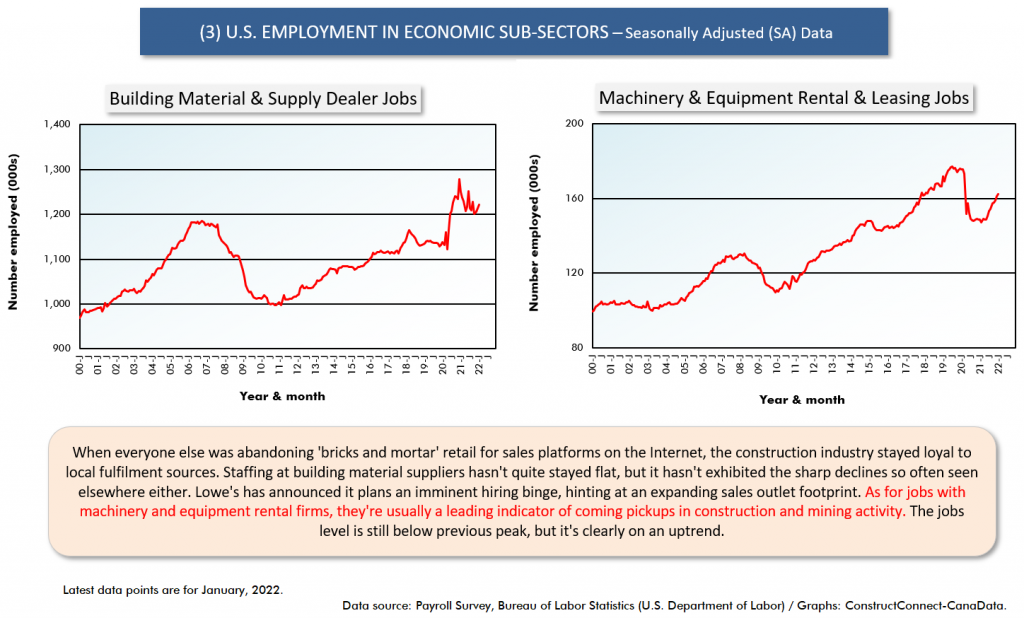
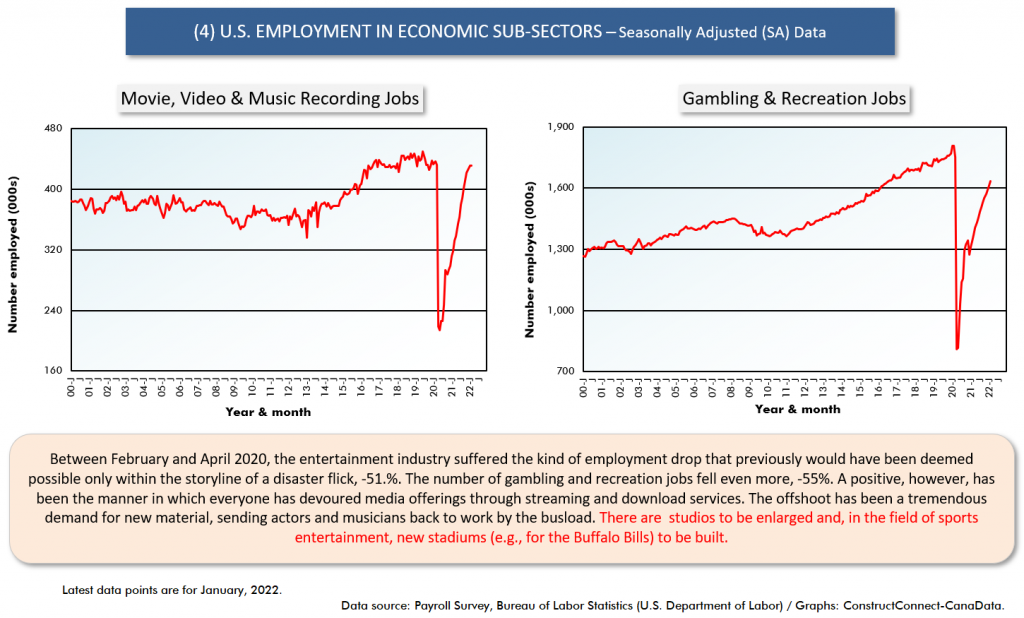
The side-by-side placing of the two graphs in each cluster chart has been done with care. The two sub-sectors have been chosen deliberately to explore a specific relationship:
- complementary (e.g., real estate and architectural/engineering design);
- moving in opposite directions (e.g., semiconductor manufacturing and software publishing)
- a lead-in from one to the other (e.g., warehousing/storage and truck transportation),
- they’re positioned within the same pocket of the economy (e.g., coal mining and oil/gas exploration).
In each cluster chart, the accompanying text box at the bottom provides insight into where employment in the sectors has been and where it’s going and what will be the likely implications for construction activity.
The sub-sector titles are the designations adopted by the Bureau of Labor Statistics (BLS).
Cluster Chart 1
Cluster Chart 2
Cluster Chart 3
Cluster Chart 4
Cluster Chart 5
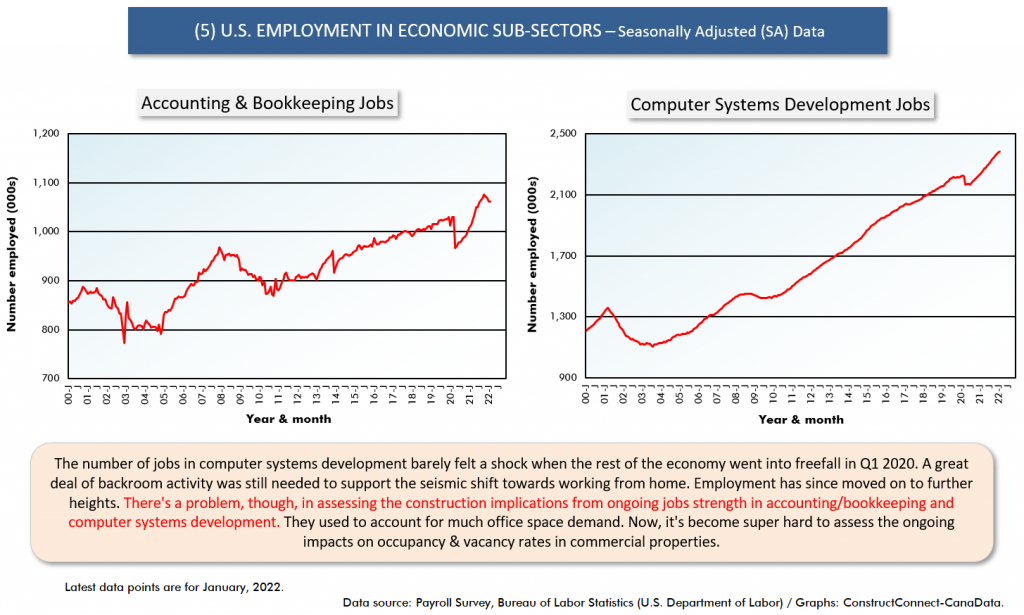
Cluster Chart 6
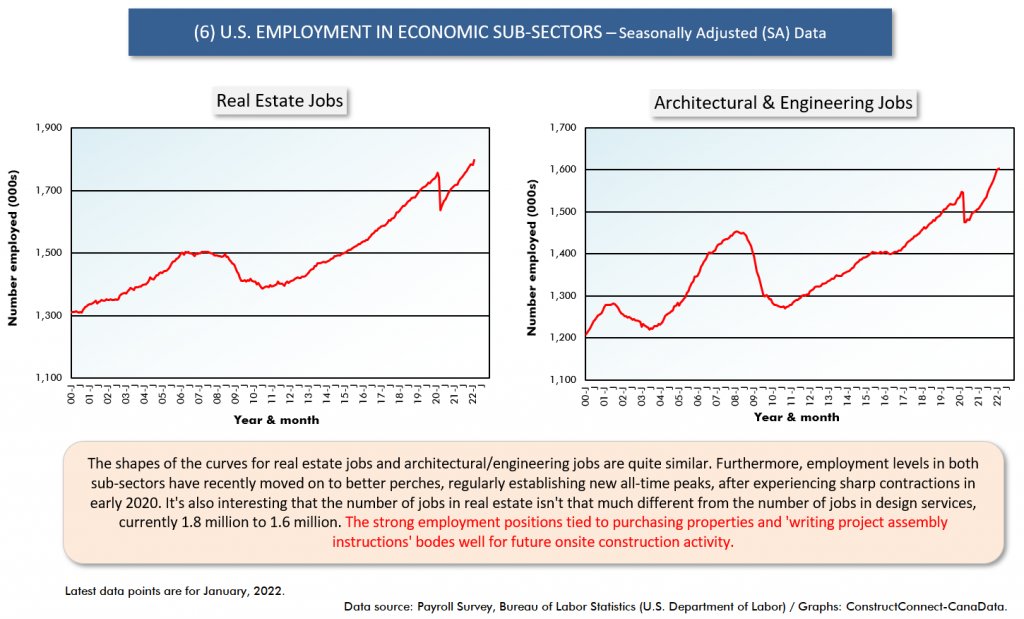
Cluster Chart 7
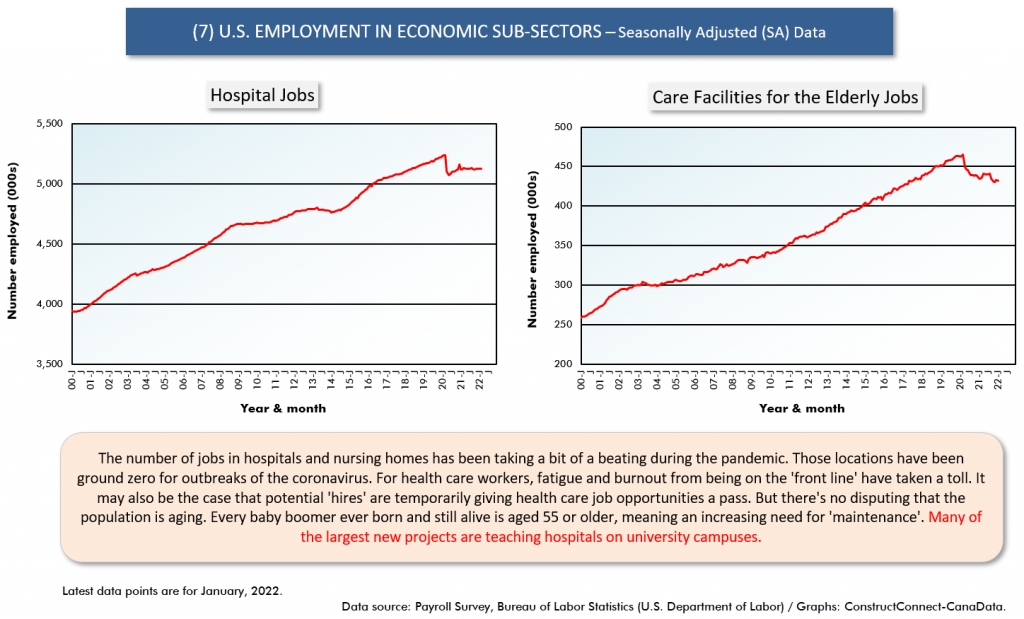
Cluster Chart 8
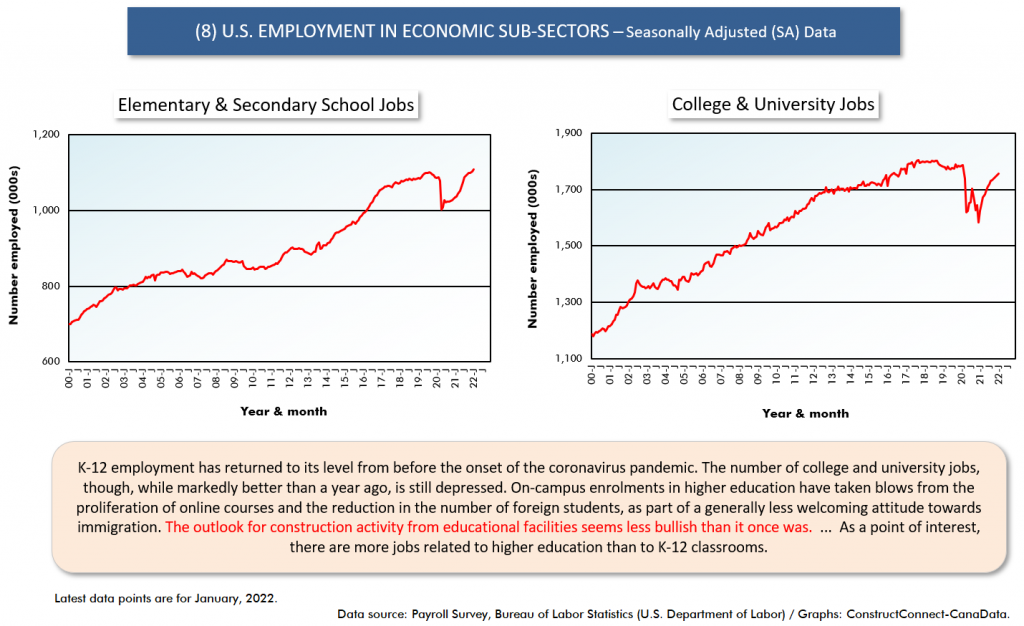
Cluster Chart 9
Cluster Chart 10
Cluster Chart 11
Cluster Chart 12
Cluster Chart 13
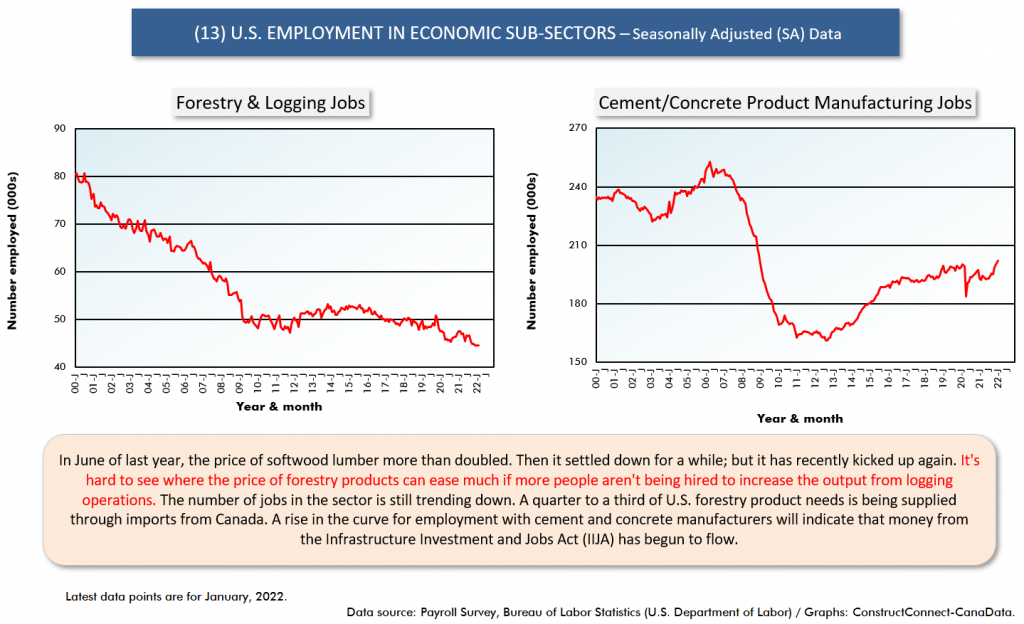
Cluster Chart 14
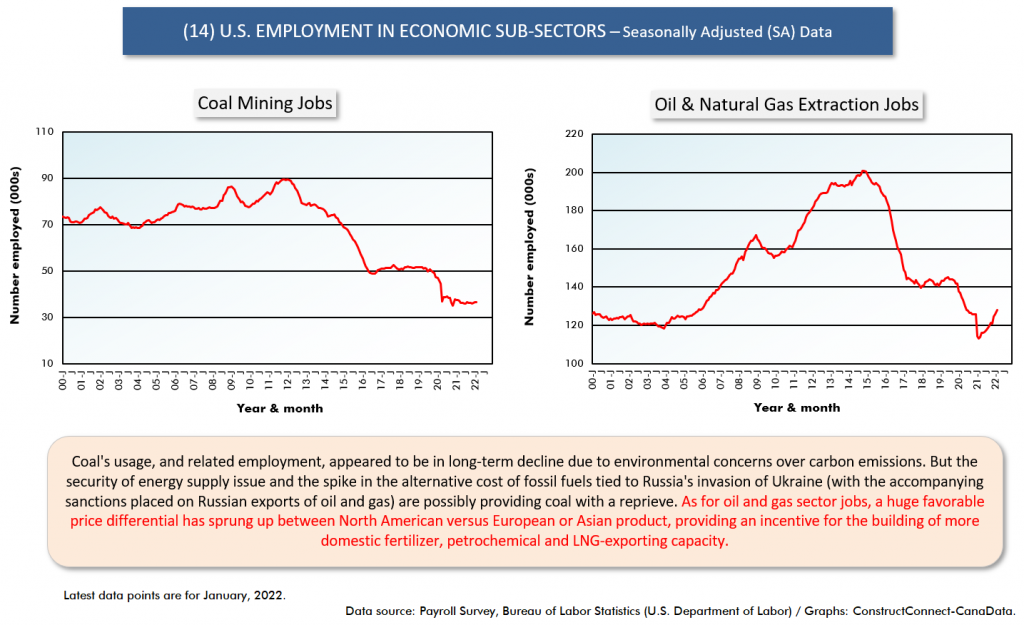
Cluster Chart 15
Alex Carrick is Chief Economist for ConstructConnect. He has delivered presentations throughout North America on the U.S., Canadian and world construction outlooks. Mr. Carrick has been with the company since 1985. Links to his numerous articles are featured on Twitter @ConstructConnx, which has 50,000 followers.


Recent Comments