The following sets out in pictorial form (i.e., in graphs with some descriptive text) employment histories in particularly interesting industrial corners of the U.S. and Canadian economies. For the U.S., the data points go back to January 2000; for Canada, the earliest figures are for January 2002.
Graphs 1 and 2: In the Great Recession of 2008-2009, U.S. total employment fell by 6%. It dipped to a level that was even less than its lowest point in the aftermath of 2001-2002’s ‘dot.com’ collapse. Since early-2010, U.S. jobs have come roaring back. They are now +12% compared with their Great Recession trough and +5% versus their prior peak at the end of 2007.
Canada’s jobs retrenchment in the Great Recession was a minimal -2%. Housing starts fell somewhat in the Big Dip, but not to anything like the degree in the U.S. (i.e., -80%) and an aggressive stance on infrastructure spending by all three levels of government – federal, provincial and municipal – helped sustain other construction activity. Canadian total employment is now +10% relative to its last low point and +8% versus its previous high point.
(seasonally adjusted data)
Jobs – U.S. Total
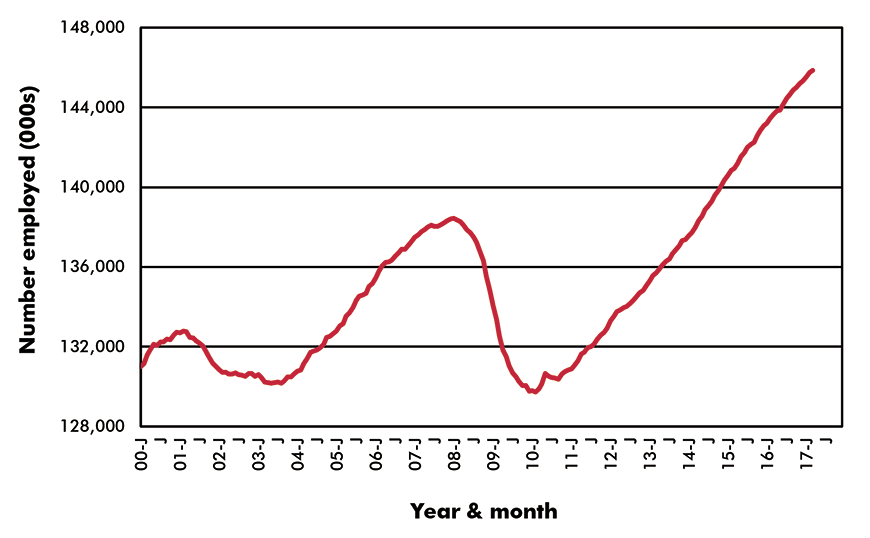
Chart: ConstructConnect.
(12-month moving averages placed in latest month)
Jobs – Canada Total (SA)
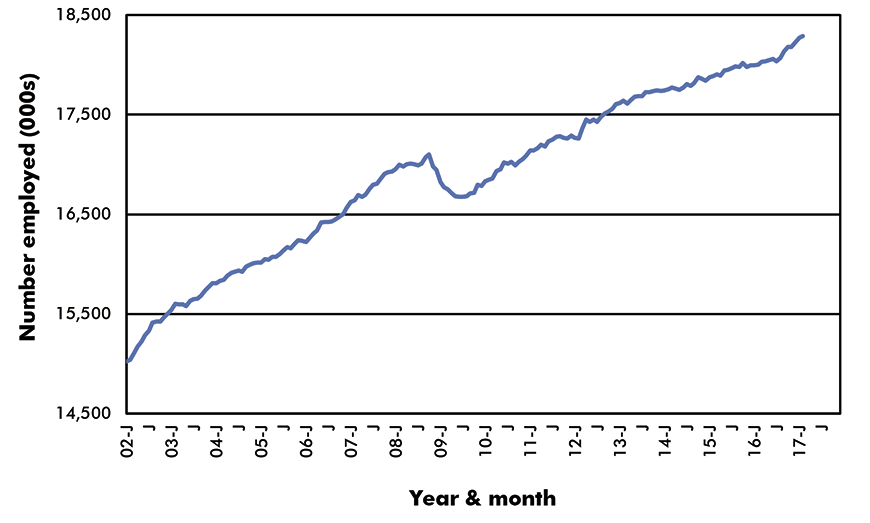
Chart: ConstructConnect.
Graph 3 and 4: Since the turn of the century, there has been a stunning retreat in the number of jobs in manufacturing in both the U.S. and Canada. In the single decade of the 00s, the U.S. lost nearly one-third of its production-line workers and Canada, more than one-quarter.
Over the past seven years, the U.S. manufacturing sector has been gradually increasing its staffing. Canadian hiring, though, has remained flat. The exchange rate between the two nations suggests that the opposite should be the case. The lower-valued Canadian dollar (i.e., the ‘loonie’) should be providing a significant boost to the export sales of manufacturers based north of the border when selling into the American marketplace. There has been some improvement in cross-border shipments on account of the currency effect, but it has fallen far short of expectations.
(seasonally adjusted data)
Jobs – U.S. Manufacturing
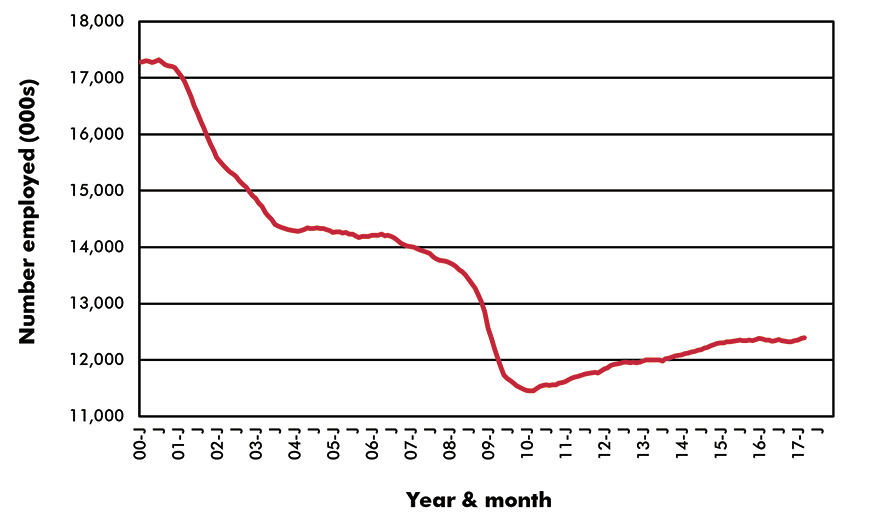
Chart: ConstructConnect.
(12-month moving averages placed in latest month)
Jobs – Canada Manufacturing
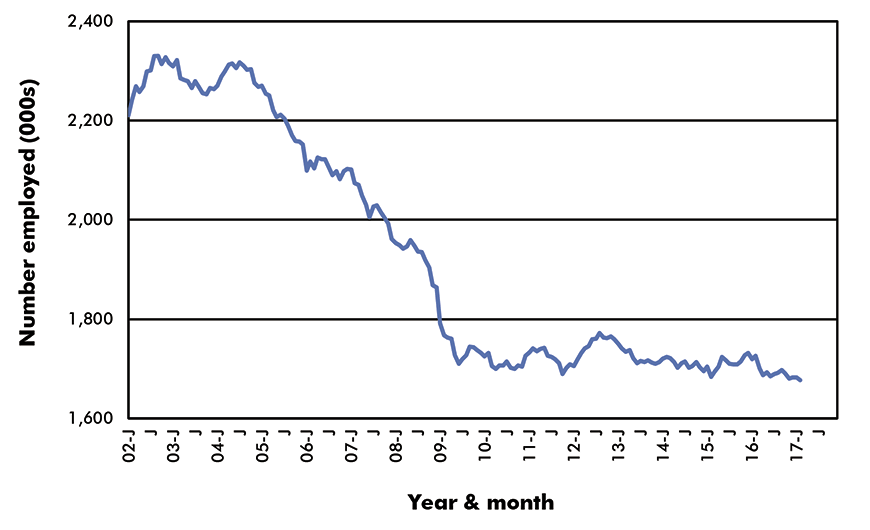
Chart: ConstructConnect.
Graphs 5 and 6: Where manufacturing jobs have been staging a comeback, in both the U.S. and Canada, has been in motor vehicle assembly and parts production. In the midst of the Great Recession, two of the three largest North American automakers – GM and Chrysler − were saved from bankruptcy by government intervention. Now those firms, through a change in ownership (Fiat/ Chrysler) and re-jigged labor arrangements (i.e., having to do with legacy pension and health care commitments), are thriving.
U.S. auto sales last year matched historical peaks and car and light truck purchases by Canadian consumers have been setting new all-time highs. Still, outsourcing of work to lower-cost nations and the wide-spread adoption of more mechanization on production lines (e.g., robotics) has so far not allowed jobs in the U.S. and Canadian auto sectors to climb back to where they once were.
(seasonally adjusted data)
Jobs – U.S. Motor Vehicle Assembly & Parts
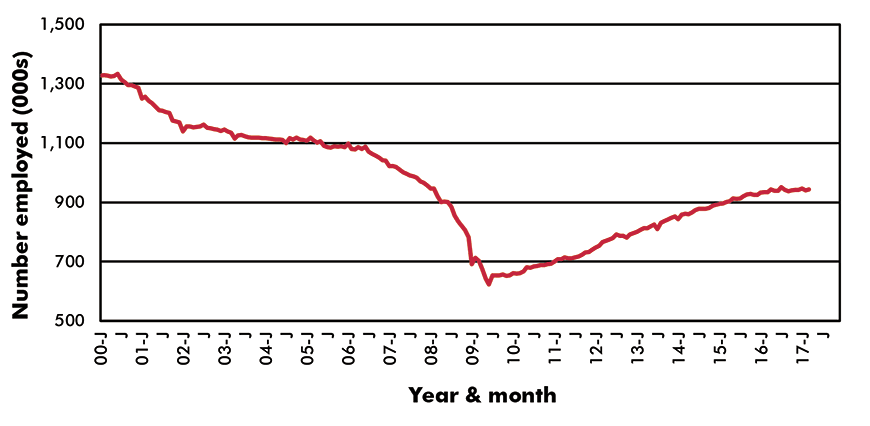
Chart: ConstructConnect.
(12-month moving averages placed in latest month)
Jobs – Canada Motor Vehicle Assembly & Parts
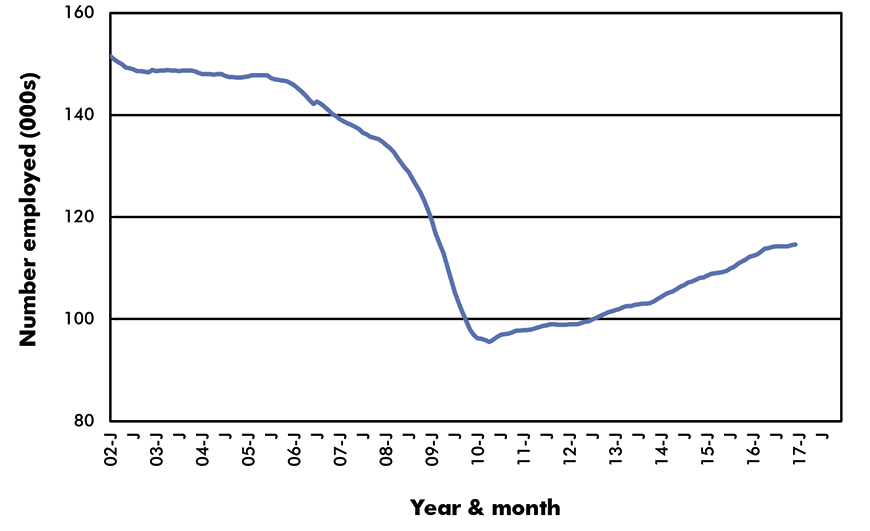
Chart: ConstructConnect.
Graphs 7 and 8: When one thinks of jobs in manufacturing, cars and trucks and airplanes and maybe farm and construction equipment are likely to be the first products to come to mind. There is an industry subsector that is grossly overlooked. As becomes quickly apparent when one looks back and forth between the vertical axes in Graphs 5 and 6 and those in Graphs 7 and 8, food manufacturing is not given enough respect.
Current employment in U.S. food manufacturing, at a level of more than 1.6 million, considerably outdistances U.S. auto sector employment of a little more than 900,000. The disparity is equally dramatic in Canada: more than 220,000 jobs making ‘edibles’ versus less than 120,000 making and equipping ‘chariots’.
(seasonally adjusted data)
Jobs – U.S. Food Manufacturing
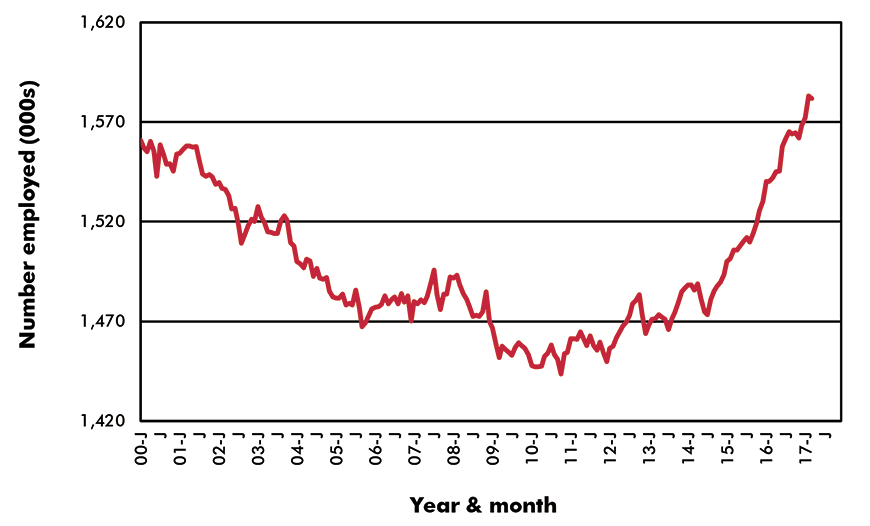
Chart: ConstructConnect.
(12-month moving averages placed in latest month)
Jobs – Canada Food Manufacturing
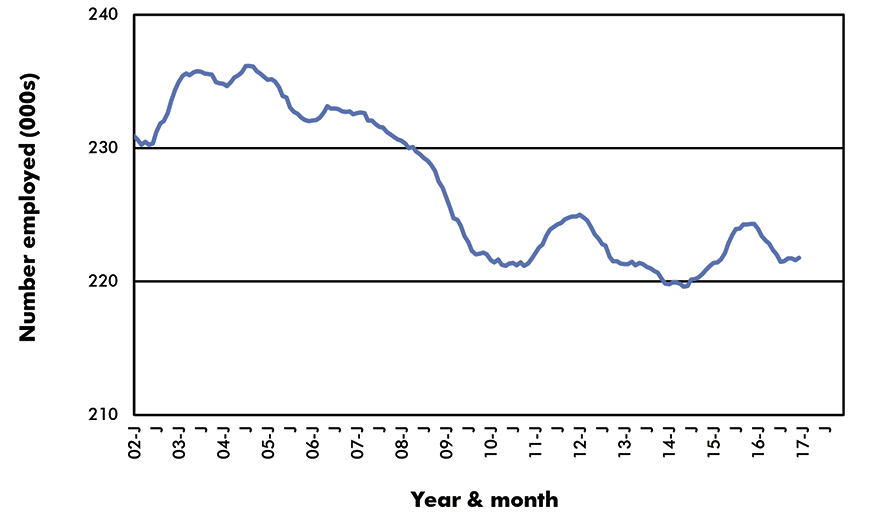
Chart: ConstructConnect.
Graphs 9 and 10: When looking at the record of jobs growth in solely-Internet retail sales in the U.S., one would be hard pressed to say anything other than, “Wow!” Since 2000, the curve in Graph 9 has exploded exponentially. Total employment provided by shopkeeper ‘platforms’ has risen by a factor of four.
Several of the brightest corporate stars (e.g., Amazon, Apple, etc.) in the new high-tech firmament have risen to their positions of prominence through connecting better and digitally with consumers. Some former giants among ‘bricks and mortar’ retailers (e.g., Sears) have been left by the roadside waiting for transportation that has changed routes.
The performance of Internet retail jobs in Canada throughout most of the 00s was disappointing, but a recovery of lost ground, followed by steep and truly impressive upward advances, has been achieved since 2010.
(seasonally adjusted data)
Jobs – U.S. Solely Internet Retail Sellers
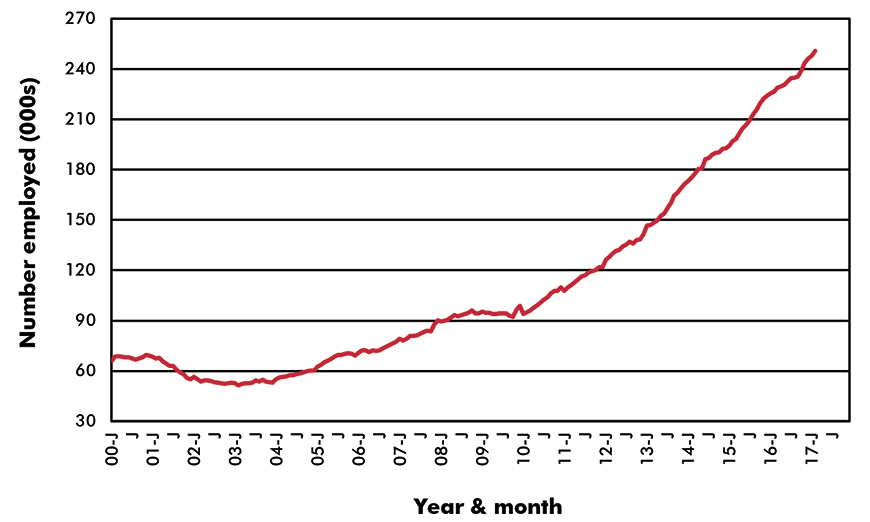
Chart: ConstructConnect.
(12-month moving averages placed in latest month)
Jobs – Canada Solely Internet Retail Sellers
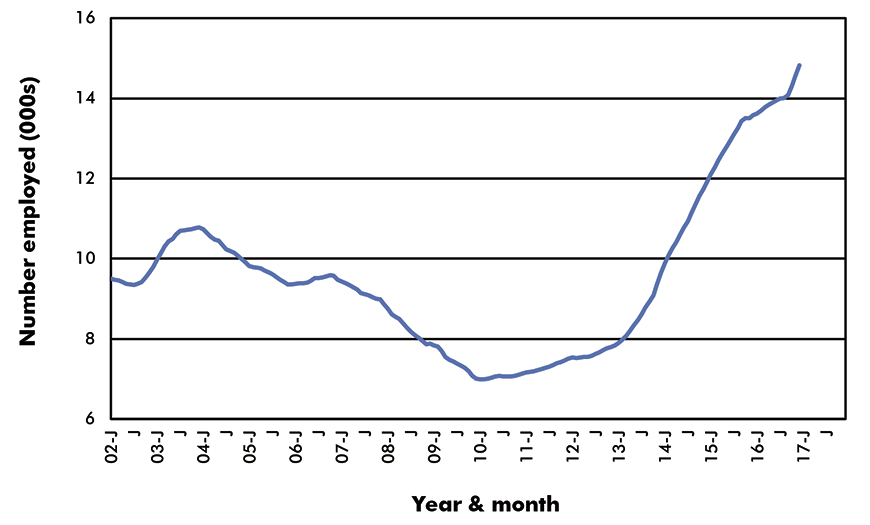
Chart: ConstructConnect.
Graphs 11 and 12: The U.S. has managed a doubling in employment in ‘warehousing and storage’ since the 20th century became the 21st. The climb in such jobs has turned especially vertical during the past two-and-a-half years.
Courier services helped launch the first wave of hiring improvement in this sector. But a need for giant distribution centers to ship consumer-goods bought electronically, with increasingly short delivery-times, has speeded up the process. A next major push will come from more local distribution hubs that will be dispensing groceries, home-cooked meals, flowers and all manner of other desirable items. The emphasis will be on relieving the stress of busy days.
Canada, especially in 2006-2007, was quick off the mark in benefitting from more ‘warehousing and storage’ jobs, but has gained no traction since.
(seasonally adjusted data)
Jobs – U.S. Warehousing & Storage
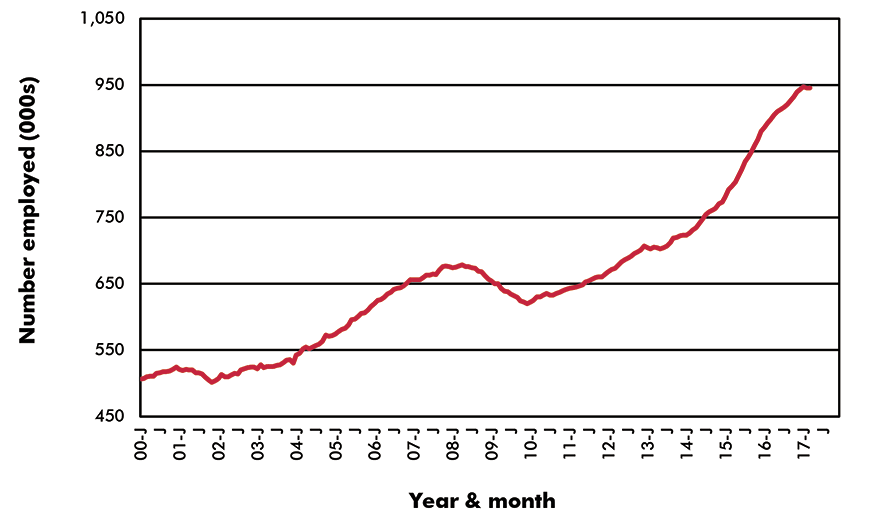
Chart: ConstructConnect.
(12-month moving averages placed in latest month)
Jobs – Canada Warehousing & Storage
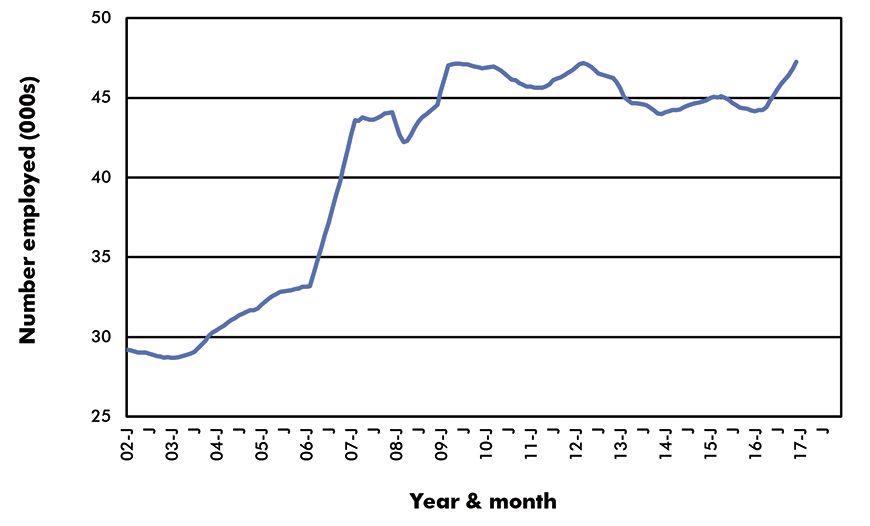
Chart: ConstructConnect.
Graphs 13 and 14: An even worse pattern, Canada versus U.S., has emerged in ‘call center and telemarketing’ employment. Throughout almost the entire period shown in Graph 13, the U.S. has been on a sharply rising path of job creation. Canada was ‘gung-ho’ for such work from 2002 through early 2008, but there was a steep slide subsequently that wasn’t halted even when the economy as a whole began to recover after the Great Recession.
Only lately has a slight uptick begun to re-appear in the Canadian ‘call center and telemarketing’ jobs numbers. Canada, with a wealth of individuals having expertise in more than one language, should be acquiring more of this work – for example, sites in New Brunswick were early off the mark in setting up such facilities. Nevertheless, the new jobs in this field have been spreading out to other locations, in the U.S., India, the Caribbean, the Philippines, and so on.
(seasonally adjusted data)
Jobs – U.S. Call Centers & Telemarketing
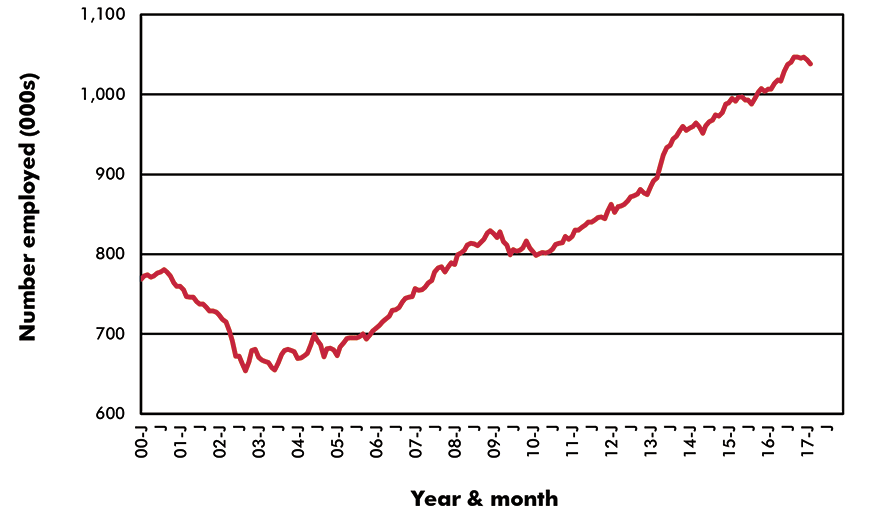
Chart: ConstructConnect.
(12-month moving averages placed in latest month)
Jobs – Canada Call Centers & Telemarketing
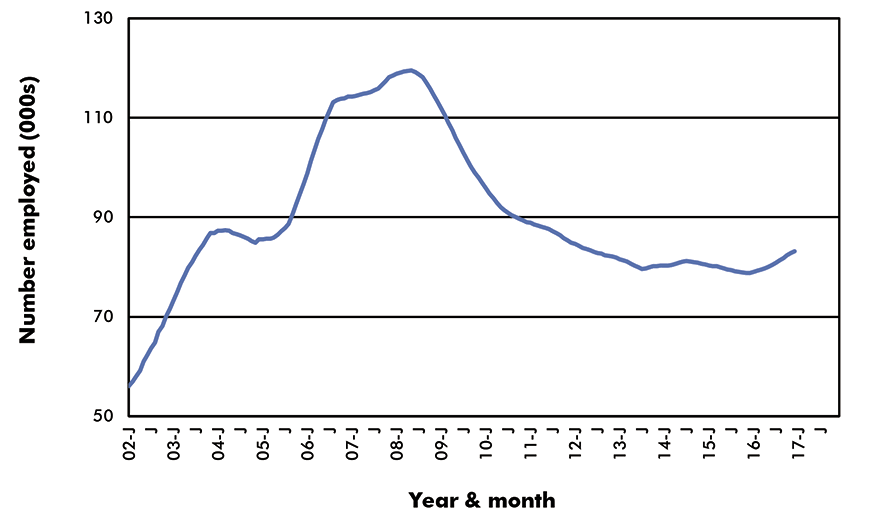
Chart: ConstructConnect.
Graphs 15 and 16: Governments nearly everywhere are promoting attempts to switch over their economies from old stodgy ways of doing business to rather adopting cutting-edge practices and methodologies. The 300%-plus appreciation, since February 2009, in the NASDAQ stock market index, which is comprised of numerous successful knowledge-driven enterprises, best exemplifies the bandwagon onto which everyone wants to ‘hop aboard’.
The healthy climb in ‘computer systems design services’ jobs in America, as shown in Graph 15, is both a reflection of the wish on the part of many companies to embrace the future, and an illustration of the notable success the U.S. has achieved in nurturing jobs in innovation. There was hardly any downward correction in such employment even in the Great Recession.
A pickup in ‘computer systems design services’ jobs has taken a little longer to gain momentum in Canada, but the pace of increase has become significantly more accelerated in the last five years.
(seasonally adjusted data)
Jobs – U.S. Computer Systems Design Services
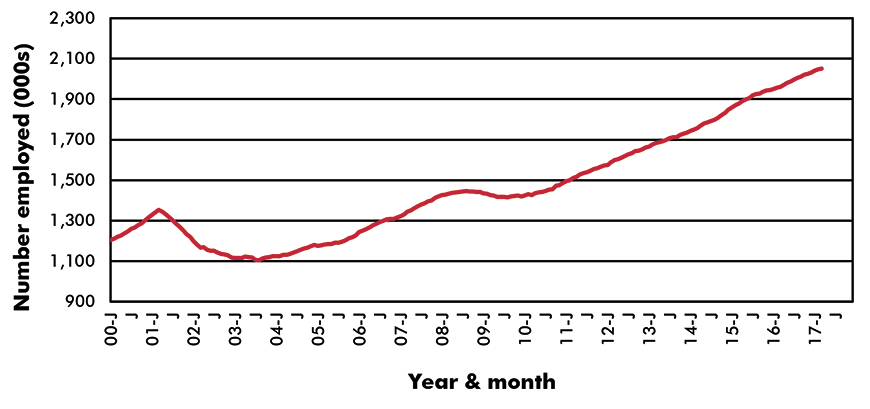
Chart: ConstructConnect.
(12-month moving averages placed in latest month)
Jobs – Canada Computer Systems Design Services
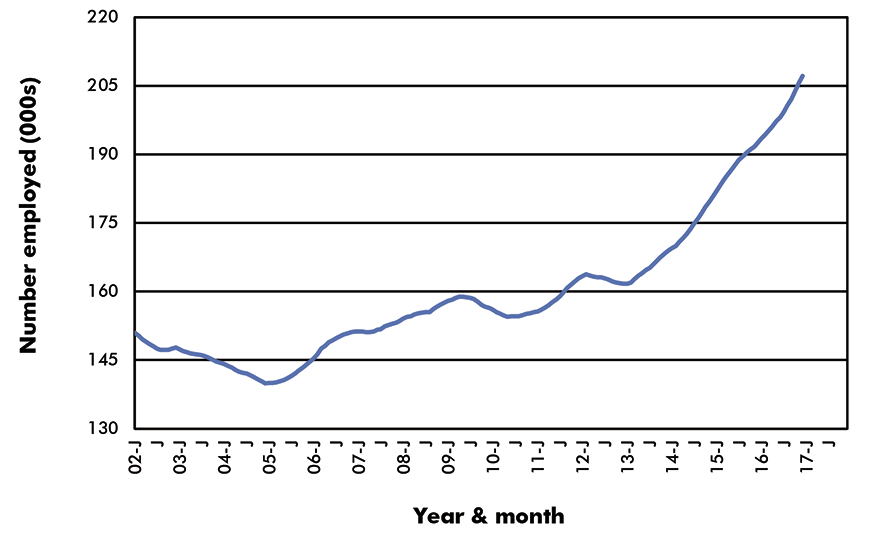
Chart: ConstructConnect.
Graphs 17 and 18: The prospects for employment in the health care field have been almost nothing but positive over the past dozen to 15 years in both the U.S. and Canada, and the outlook – given the aging nature of the post-World War II baby boom generation (i.e., those born 1946-1964) – is for more of the same.
There has been one glitch. The uncertainty surrounding the longevity of the Patient Protection and Affordable Care Act (PPACA) since its introduction in 2010, has made hospital employment more of a chance proposition. Nor has this been resolved under the recently-elected Republican administration in the White House. Proposed makeover legislation failed to even reach a vote. Hospitals want to know if the financing of patient care is assured.
But jobs at senior citizens’ residences and in home health care have been climbing steadily. And once the tidal wave of baby boomers starts to move beyond the age of 80 (by the mid-2020s), the need for ‘caregivers’ and assorted other helpers will steamroll faster.
(seasonally adjusted data)
Jobs – U.S. Home Health Care
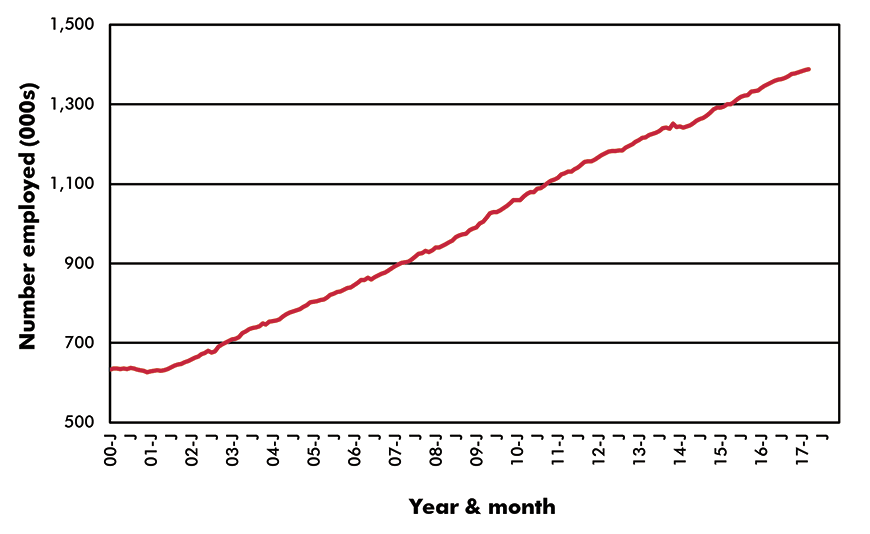
Chart: ConstructConnect.
(12-month moving averages placed in latest month)
Jobs – Canada Home Health Care
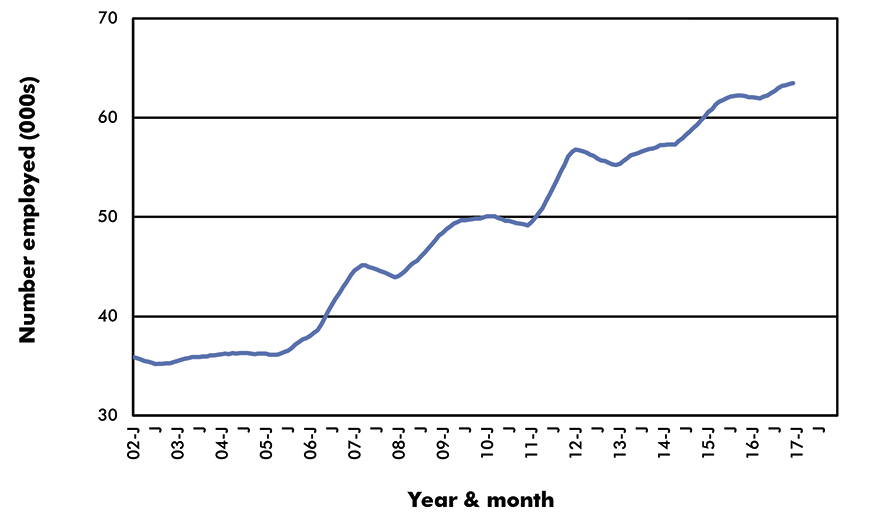
Chart: ConstructConnect.
Graphs 19 and 20: U.S. construction employment plummeted in the Great Recession mainly because housing starts nearly dried up completely. The number of U.S. construction jobs now, though, is almost on a par with where it was in the early 00s.
2006 and 2007 do not represent ‘normal’ for U.S. construction jobs. In those two years, a bubble in new home construction developed, brought on by the issuance of subprime mortgages. It was the bursting of that bubble, as foreclosures skyrocketed, that caused ensuing years of distress throughout the economy (see also Graph 23 for the financial sector.)
Canada stayed the course in construction employment much better than the U.S. during the Big Dip. There was ongoing work in mega resource projects, plus housing didn’t falter as badly and the public sector stepped in with infrastructure undertakings (especially hospitals).
But looking forward, it is the U.S. where employment at architectural and engineering firms is clearly on the rise. Activity in the offices of design professionals occurs out front of structure-erecting work in the field. In Canada, the design professions have been cutting staff for quite a while now, and most obviously since the tumbling of world-trade-dependent commodity prices.
(seasonally adjusted data)
Jobs – U.S. Construction
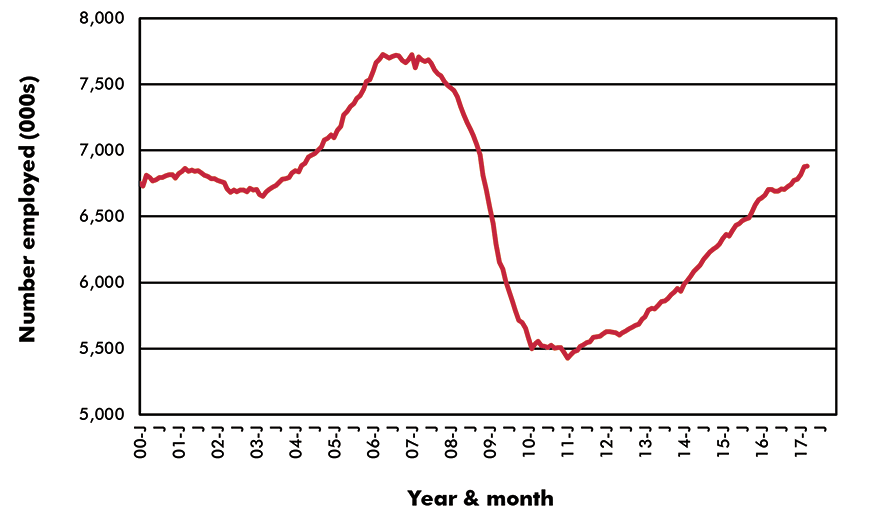
Chart: ConstructConnect.
(12-month moving averages placed in latest month)
Jobs – Canada Construction (SA)
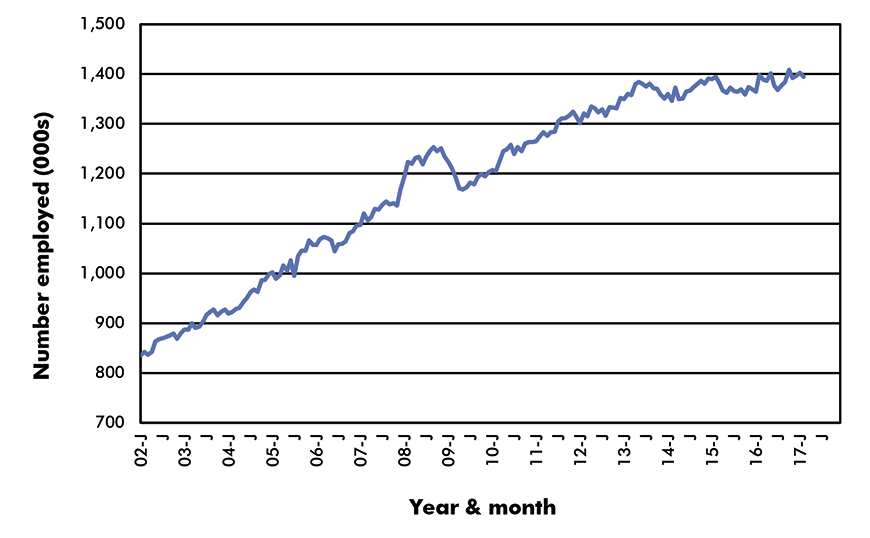
Chart: ConstructConnect.
Graphs 21 and 22: Three of the final four graphs feature resource or raw material subsectors. Graph 21 shows employment in U.S. coal mining. President Trump has promised coal miners that he will do what he can to restore their pay checks. ‘Executive orders’ are cutting regulations governing carbon emissions. But not only is natural gas a cleaner and cheaper means to generate electricity than coal, but solar and wind power have become increasingly popular as well.
In Canada, the ‘forestry and logging’ sector forms an important part of almost every provincial economy. At the very least, it’s important to what Canadians perceive as their pioneering heritage. The improvement in housing starts that is underway in the U.S. should help Canadian lumber producers generate more export sales. But the expiry of the Softwood Lumber Agreement (SLA) opens the door to all sorts of trading turmoil.
The SLA ran its course a year-and-a-half ago, triggering a one-year moratorium on any dumping charges, countervailing duties or other legal action. That grace period has now ended and if the past holds a lesson, it’s that vociferous wrangling – largely conducted through the media − is sure to break out.
(seasonally adjusted data)
Jobs – U.S. Coal Mining

Chart: ConstructConnect.
(12-month moving averages placed in latest month)
Jobs – Canada Forestry & Logging
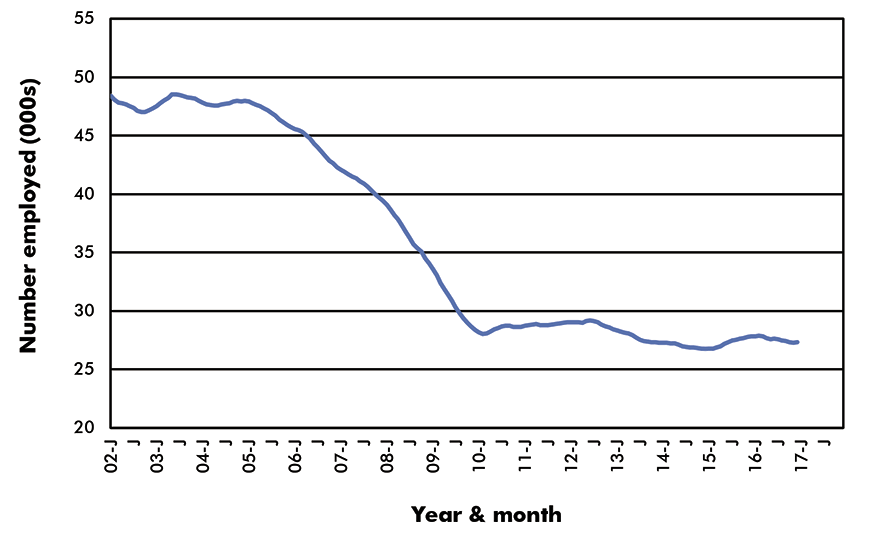
Chart: ConstructConnect.
Graphs 23 and 24: The subprime mortgage mess of 2008-09 led to a credit crunch that sent financial services firms around the world into a tailspin. A whole layer of independent U.S. investment banking disappeared. For remaining players, questions about ‘too big to fail’ and ‘capitalization’, followed by regulatory agencies demanding ‘stress tests’, became pre-occupations. Therefore, it is good news to see that after a deep depression in the jobs level in the industry in 2010-2011, staffing has recently returned – after a gap of ten years − to its former pinnacle.
Canada’s economy does have many other things going for it than oil and natural gas, but as Graph 24 makes clear, it would sure be nice if fossil fuel prices avoided any further pullbacks and instead stayed stable or set out on a slow but steady hike upwards. It helps that Saudi Arabia wants to take Aramco public, providing an incentive for output controls that are lifting the price of crude to near or above $50 USD per barrel. In the U.S. oil and gas sector, where the hydraulic fracturing of shale rock now dominates all discussion, February and March featured back-to-back month-to-month employment increases for the first time in a long while.
(seasonally adjusted data)
Jobs – U.S. Financial Activities
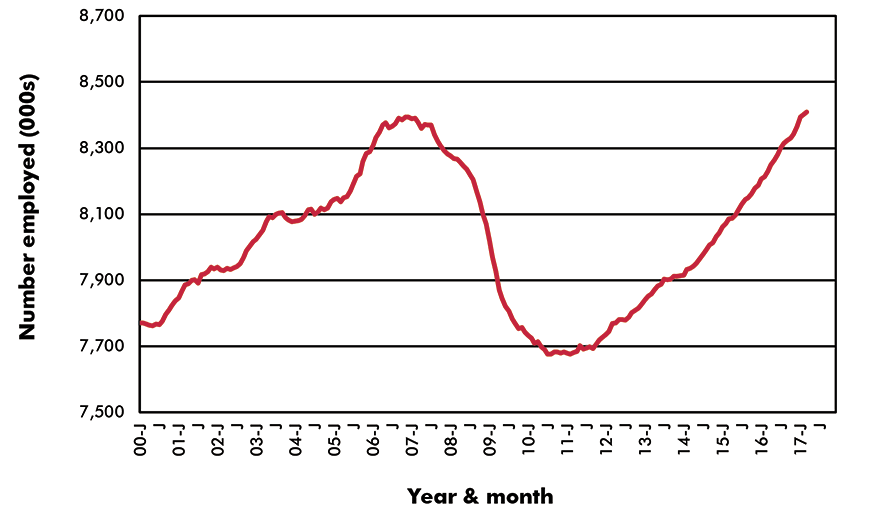
Chart: ConstructConnect.
(12-month moving averages placed in latest month)
Jobs – Canada Oil & Gas Extraction
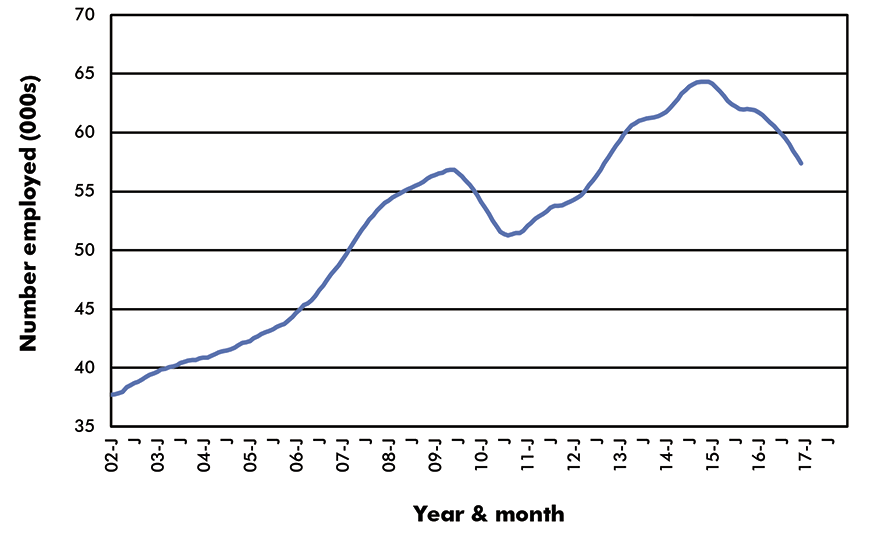
Chart: ConstructConnect.


Recent Comments
comments for this post are closed