For the second time this year, the Open Market Committee (FOMC) of the Federal Reserve has raised its trend-setting interest rate. The tightening steps have been small so far. Each hike has been +0.25 basis points, where 100 basis points equals 1.00%. The new range target for the federal funds rate is 1.00% to 1.25%. A third bump is considered likely later in 2017.
The Fed acknowledges that substantial payroll gains remain elusive; that inflation will remain below 2.0% over at least the short term; and that economic growth will be hard pressed to achieve a level beyond ‘moderate’. But labor markets are continuing to tighten. And the Fed wants to get on with ‘normalizing’ its balance sheet. It bought enormous amounts of government debt as part of its several quantitative easing programs. The Fed has now set out a methodology for gradually reducing those holdings.
Set against the foregoing backdrop, there are the following additional economic ‘nuggets’ to be gleaned from the latest government agency and private sector data releases.
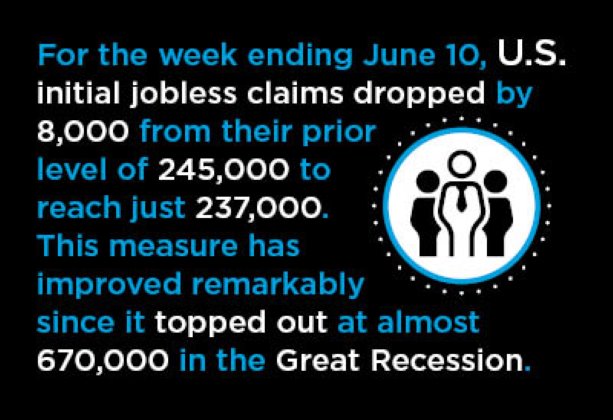
(1) For the week ending June 10, U.S. initial jobless claims dropped by 8,000 from their prior level of 245,000 to reach just 237,000. This measure has improved remarkably since it topped out at almost 670,000 in the Great Recession. It has gradually fallen to the point where it has been less than 300,000 for 119 weeks in a row, a stretch of time that exceeds two years. There has been no comparable period of success for this number dating back to the early 1970s when it was first calculated.
(2) The U.S. total jobs improvement year over year in May was a rather run-of-the-mill +1.6%, but there were some sub-sectors that managed more eye-catching performances: ‘electronic shopping and electronic auctions’, +10.9%; ‘temporary help services’, +4.9%; and ‘warehousing and storage’, +4.0%.
(3) Some other notable employment changes in May were as follows. ‘Coal mining’ became slightly positive, at +2.4% year over year. Twelve months ago, the sector was nearly -25.0%. ‘Elementary and secondary schools’ were +3.1%, but ‘colleges and universities’ were only half as fast, +1.6%. ‘Motor vehicle and parts manufacturing’ was +0.6%, but ‘food manufacturing’ was +3.2%. Worthy of mention is the fact that the level of employment in the latter segment of manufacturing is more than two-thirds higher than in the former.
(4) Carrying on with the theme of manufacturing, the Purchasing Managers’ Index (PMI) of the Institute of Supply Management (ISM) increased slightly in May, to 54.9%, from April’s 54.8%. A PMI reading in excess of 50.0% means that both the manufacturing sector and the economy as a whole are expanding. From 43.3% to 50.0%, ‘real’ (i.e., inflation-adjusted) gross domestic product (GDP) is on the upswing, but manufacturers are struggling. Below 43.3%, nobody’s wearing a smile. The present level of the PMI, when annualized, has historically corresponded with a +3.7% year-over-year increase in ‘real’ GDP.
(5) The ISM’s survey of members in May also found production to be down to a minor degree, but new orders and employment to be on the rise. There was also an increase in raw materials prices for the 15th month in a row, but the speed of the climb has decelerated considerably.
(6) U.S. available employment positions as reported by the Bureau of Labor Statistics (BLS) in its Job Openings and Labor Turnover (JOLTS) report reached a ‘series high’ of 6.044 million, seasonally adjusted, in April. The year-over-year percentage change was +7.1%. Job openings in some employment categories are now way more prevalent than they were a year ago. For example, in ‘finance and insurance’, they are +17.5%; in ‘accommodation and food services’, +13.3%; and with ‘government’, +10.7%. The government increase is outside Washington and is dominated by ‘state and local education’, +20.4%.
(7) Job openings in construction are +10.3% year over year, moving from 184,000 in April 2016 to 203,000 in April 2017. Positions in ‘retail’ are -2.4% y/y. This comes as no surprise as numerous well-known ‘bricks and mortar’ shopkeepers grimly proceed with plans to shutter more locations.
(8) One of the key statistical series in the JOLTS report is the ‘Quits’ rate. Theoretically, it should become elevated when employed individuals become more confident concerning alternative job prospects. They will be more willing to drop what they are currently doing and switch loyalties to another employer. The Quits rate (i.e., as a percentage of total employment) is currently 2.0%, little change from last April’s 2.1%.
(9) But it’s not just the level of the Quits rate that I find interesting. Also fascinating is the variation that can exist between industries. Some kinds of work are inherently more stable. For example, at one extreme is ‘accommodation and food services’, which currently has a Quits rate of 4.2% (down from 4.6% a year ago). At the other end of the spectrum is ‘government’ with a Quits rate of only 0.7% (down from 0.8% a year ago). ‘Construction’ is relatively mainstream at 2.4% (up from 1.7% 12 months ago).
(10) Regionally, the Quits rate is presently at its greatest in the South (2.3%), followed by the West (2.1%) and Midwest (2.0%). Workers are ‘staying put’ most doggedly in the Northeast (1.6%).
(11) U.S. GDP growth quarter to quarter and annualized in 2017’s first quarter was a disappointing +1.2%. National output was held back by a consumer spending performance that was lame, +0.6%. (Personal Consumption Expenditures/PCE are nearly 70% of GDP.) Nor does the most recent report on U.S. retail sales from the Census Bureau generate much enthusiasm. Total retail sales in May were +3.8% year over year, whereas the benchmark for a ‘solid’ month is +5.0%. Sales by motor vehicle and parts dealers were a similarly restrained +3.7%. General merchandise stores rang up receipts that were only +1.3% y/y. In good news for the construction sector, ‘building material and garden equipment and supplies dealers’ had a stellar month, +10.8% y/y. Finally, non-store retailers (i.e., those selling in cyberspace) also managed a double-digit percentage gain, +10.2% y/y.
(12) At +1.8% y/y, Canada in May achieved its best advance in total jobs since February 2013, more than four year ago. Unfortunately, the unemployment rate has stubbornly resisted much downward progress, although at a current level of 6.6%, it is a little better than May 2016’s 6.9%. (By way of comparison, the U.S. jobless rate is now about as low as it has ever been, only 4.3%, although it needs to be acknowledged that the BLS is more stringent about who it considers to be seriously looking for work.). Canada is happy, for the moment, to be standing on a surf board that is riding the wave of a strong +3.7% Q1 2017 GDP growth rate.
(13) Quite a number of Canadian sub-sectors recorded exceptional year-over-year jobs increases in the latest month. Those with standout advances were: ‘electronic shopping’, +16.2%; ‘ship and boat building’, +13.7%; ‘computer systems and design services’, +10.0%; ‘movies, videos and music production’, +6.3%; ‘temporary employment services’, +5.9%; and ‘community care for the elderly’, +5.1%. Two sectors continued to fall behind badly: ‘aerospace products and parts’, -9.6%; and ‘oil and gas extraction’, -8.9%.
(14) May was the first month of this year that total Canadian housing starts, seasonally adjusted and annualized, did not exceed 200,000 units. Instead, they came up a little short, at 195,000 units. Nevertheless, the monthly average of residential groundbreakings so in 2017, at 216,000 units, is +11.0% compared with 2016’s first-five-months average of 195,000 units.
(15) Year-to-date home starts in Canada’s six largest population centers have been: Toronto (15,611 units and +1% versus January-to-May 2016); Vancouver (10,231 and -14%); Montreal (8,370 and +39%); Edmonton (4,898 and +21%); Calgary (4,135 and +36%); and Ottawa-Gatineau (3,108 and +37%). Notice that the two cities – Toronto and Vancouver − where government stepped in to curb demand, claiming it was burning too hot (i.e., as reflected in huge price jumps), now have the weakest y/y starts records.


Recent Comments
comments for this post are closed