Price movements of major internationally-traded commodities are vitally important for the construction sector in two ways.
First, they can be a key determinant of when owners of resource development sites will undertake capital investments. As prices for energy and forestry products and metals and minerals increase, the likelihood of spending on new drilling and refining facilities, sawmills and pulp mills and mining extraction and milling operations increases.
Furthermore, such resource projects can sometimes assume the shape of truly immense undertakings – i.e., what have come to be termed ‘mega’ projects – and they can drive on-site employment over the course of many years.
Second, all building products, when stripped to their essentials, have a commodity base (e.g., copper in plumbing and lighting; hydrocarbons in vinyl siding and PVC pipes; etc.). Therefore, commodity pricing plays a significant role in construction material costing.
After many years of misstarts and course corrections, the world is finally experiencing a ‘synchronous’ expansion. The pickup in global trade is being accompanied by many commodity price hikes.
Within this context, there are two questions for construction industry managers to be considering. As a potential positive, should they be feeling greater enthusiasm about the prospects for resource sector mega projects? As a potential negative, should they be worrying about large imminent bumps in construction material costs?
Graphs 1 through 5 show commodity price indices for market segments as calculated by the Bank of Canada. Exchange rate differences are not a factor. The indices in the graphs are all based on actual prices in U.S. dollars. (Almost all internationally-traded commodities are officially priced in ‘greenbacks’.)
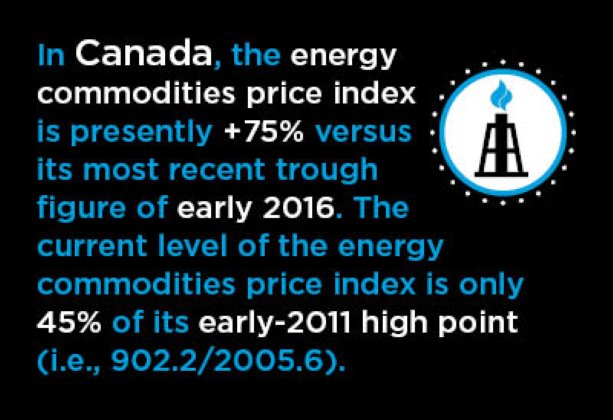
In Graph 1, the energy commodities price index is presently +75% versus its most recent trough figure of early 2016 (i.e., 902.2 compared with 516.6). Recognizing that it’s imperative to provide perspective, however, the current level of the energy commodities price index is only 45% of its early-2011 high point (i.e., 902.2/2005.6).

Chart: ConstructConnect.
In Graph 2, the metals and minerals commodities price index is +21% relative to its early-2016 low point (i.e., 573.1 compared with 474.9), but it is languishing at only 69% of its prior peak in early 2011 (573.1/830.5).

Chart: ConstructConnect.
Graph 3 records an agricultural commodities price index that is +20% versus its last trough of a year ago (i.e., 228.5 compared with 191.0), but it has climbed back only 70% of the way to where it stood in much of 2011-2013 (228.5/320.4).

Chart: ConstructConnect.
The forestry commodities price index, set out in Graph 4, is unique in being higher (i.e., 411.7/313.0 = +32%) relative to both its most recent bottom and its previous summit (411.7/390.9 = +5%).

Chart: ConstructConnect.
The total commodities price index, appearing in Graph 5, is presently +40% over its position at the beginning of 2016 (i.e., 411.8 compared with 293.5), but it is barely more than halfway (56%) back to where it was at the start of 2011 (411.8/741.8).

Chart: ConstructConnect.
Also noteworthy is the fact that the total commodities price index has returned less than halfway (47%) to where it was in 2008 (411.8/741.8), immediately prior to the arrival of the Great Recession.
In summary, Graphs 1 through 5 suggest there should be little disruption to most construction managers’ nocturnal re-charging patterns from the so-far modest upward adjustments in commodity prices.
Neither should they be staying up too late to celebrate an imagined waft of new resource sector mega projects nor should they be losing a great deal of sleep, quite yet, over worries about significantly rising construction material costs.


Recent Comments
comments for this post are closed