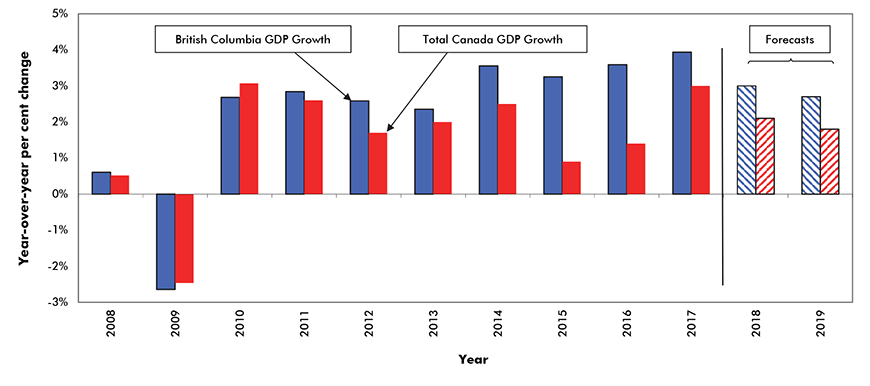
In our last B.C. economic update, a year ago, we said the province “should continue to outperform the country as a whole in 2017 and 2018”. Well, according to the just-released provincial GDP statistics, the B.C. economy expanded by 3.9% y/y in 2017, well ahead of the 3% gain recorded by the country as a whole and second only to the 4.9% y/y increase posted by its next door neighbour, Alberta.
It is highly unlikely that the Pacific province can maintain this well-above-potential pace of activity into 2019. While several key measures of B.C.’s economic health remain quite positive, the medium term outlook for the province is overshadowed by significant uncertainty regarding the expansion of the Kinder Morgan Pipeline as well as the Port of Vancouver’s Roberts Bank Terminal 2 Project.
Turning first to the labour market, the fact that total employment has contracted by 9,500 jobs year to date suggests employers in the province have put their hiring plans on hold. Having said this, a number of recent statistics suggest this pause in hiring is due to a scarcity of workers rather than too few vacant jobs.
First, in Q1 of this year, B.C.’s unemployment rate averaged 4.7%, its lowest print since Q2 of 2006. Second, according to the Canadian Federation of Independent Business’ Job Vacancy Report, British Columbia’s private sector job vacancy rate stood at 3.9% in Q4/2017, a ten-year high and the highest among the ten provinces.
Reflecting this strong demand for labour, total employee compensation in B.C. increased by 5.7% y/y in 2017, well ahead of the 3.9% y/y gain posted by the country as a whole. It is also worth noting that the steady decline in the province’s unemployment rate over the past year was accompanied by an inflow of 49,600 migrants from outside the country and 10,200 from other provinces.
Fuelled by low interest rates and the solid gain in employee compensation noted above, consumer spending, reflected by retail sales over the past six months, is up by 7.5% year/year, well ahead of the 5.5% increase reported for the country as a whole.
Although the introduction of the new OSFI Mortgage Stress Test appears to have caused existing home sales to retreat by -11.4% year to date, the volume of housing starts is up by 11% largely driven by a 15% year-to-date gain in starts of multiple units. The more restrictive mortgage regulations plus efforts to cool the housing market introduced early this year will probably have a negative impact on housing demand going forward.
However, we expect the impact of these measures will be partially offset by the very large inflow of international and interprovincial migrants over the past two years and the prospect that the province will continue to attract a significant volume of both foreign and domestic migrants over the next several years.
The near-term outlook for non-residential building in B.C. appears relatively bright. Year to date, the value of non-residential building permits issued by municipalities in the province is 49% above the same period a year ago.
Although the bulk of this gain is due to a surge in applications to build institutional and government projects, the value of commercial and industrial projects has also exhibited solid year-over-year gains.
Looking further ahead, the threatened cancellation of the Kinder Morgan pipeline, the potential failure to approve the expansion of the Vancouver container port and the recent decline in value of B.C.’s major construction projects, largely due to a -13.2% drop in mining and oil and gas extraction, including the Malahat LNG, the Prince Rupert LNG and the Woodside LNG projects, pose a significant threat to the province’s medium-term prospects.
Real* Gross Domestic Product (GDP) Growth – British Columbia vs Canada

Chart: ConstructConnect — CanaData.


Recent Comments
comments for this post are closed