
Construction spending in various type-of structure categories is driven by economic circumstances within specific industrial subsectors. For example, manufacturers set the pace in industrial construction.

Good health in the leisure and hospitality sector provides the backing for new hotel and motel work. And jobs levels in information and financial services, as well as in more rapidly expanding fields of endeavor such as computer systems and design services, establish the need for additional office space and commercial tower square footage. (See, "Shifts in Office Jobs and Implications for Commercial Tower Construction".)
This article is the sixth in a series of seven that examines key industrial sectors to determine where they are most prominent regionally. Rankings of state strength in each industrial sub-sector are based on both ‘weight’ and ‘concentration’ of relevant employment. ‘Weight’ is simply the number of jobs in the industrial sub-sector in each state. ‘Concentration’ is each state’s number of jobs in the sub-sector divided by the state’s population. In effect, it’s a ‘per capita’ figure, except that it’s expressed as number of jobs per million population.
By ‘weight’, the states with the largest populations are almost always high in the rankings. The rankings by ‘concentration’, however, often deliver a jolt of surprise or two.
State Tiers:
It’s important to know that three clear groupings of states emerge from an analysis of the Census Bureau’s latest (i.e., through July 1, 2018) population statistics. Those groupings are: (A) the four frontrunner states by nominal levels of population – California, Texas, Florida and New York; (B) the three states with the fastest year-over-year gains in population – Nevada, Idaho and Utah; and (C) another tier of six states with both strong nominal increases and percentage changes in resident counts over the past several years – Washington, North Carolina, Georgia, Arizona, Colorado and South Carolina. (See, “Latest State Population Statistics, Maps, & Tables – Six Dark Horse Winners“.)
Also read, “Series (1 of 7): Rankings of States by Industrial Subsector Jobs – Manufacturing“; “Series (2 of 7): Rankings of States by Industrial Subsector Jobs – Financial Services“; “Series (3 of 7): Rankings of States by Industrial Subsector Jobs – Information Services“; and “Series (4 of 7): Rankings of States by Industrial Subsector Jobs – Leisure and Hospitality“; and "Series (5 of 7): Rankings of States by Industrial Subsector Jobs – Computer Systems Design".
State Leaders in Durables Manufacturing Jobs – Highlights:
Durables manufacturing entails the production of ‘big ticket’, long-lasting items such as cars and trucks, airplanes, appliances, HVAC equipment and power turbines. Historically, durables manufacturers such as GM, Westinghouse and GE have been some of the pre-eminent corporations in America, providing tens of thousands of jobs and symbolizing the industrial might of the country. The heartland of such activity has been the Mid-West.
A variety of circumstances, however, has diminished the prestige of durables manufacturing. When the dot-com sector burst on the scene in the late 90s and early 00s, durables producers became saddled with the label ‘sunset’ industry, in opposition to the bright prospects that were appearing in ‘sunrise’ data-processing and computer-assisted pockets of the economy. Also, emerging nations managed to lure away many of America’s durables manufacturing jobs.
The separation of ‘sunrise’ and ‘sunset’ industries, however, has been overblown. Another reason for the heavy loss of durables manufacturing jobs at home has been an expanded incursion of robotics-usage on production lines, the epitome of high-tech usage to achieve productivity gains. More stringent carbon emission targets and demands for greater energy-efficiency have also pushed durables manufacturers to initiate process improvements well beyond what was previously thought possible.
(1) With respect to ‘weight’ of durables manufacturing jobs, all four Tier A (i.e., high population-level) states make it into the Top Dozen. But there’s a considerable gap between first and second-ranked California and Texas and tenth- and eleventh-ranked Florida and New York. In between are the traditional industrial-powerhouses of Ohio, Michigan, Indiana, Illinois, Pennsylvania and Wisconsin – and notice that they’re all clustered in or near the Mid-West.
(2) None of the Tier B states appear in the accompanying table and only North Carolina among Tier C states has a presence, on the ‘weight’ side of the chart. Washington state, with its large Boeing airliner manufacturing operations, might have been expected to make an appearance, but it’s 12th in ‘weight’ and 14th in ‘concentration’. The catalogue of states that do appear in the table is a testament to how important ‘vehicle assembly and parts production’ is to providing jobs in the U.S.
(3) In motor vehicle assembly work, the states with the biggest shares of the U.S. total are Michigan, Kentucky and Ohio. In motor vehicle parts work, the states with the biggest slices are Michigan, Indiana and Ohio.
(4) Despite major relocations of auto sector jobs to other states, commonly in the southern U.S. (and frequently inspired by ‘right-to-work’ legislation, limiting the power of unions), Michigan is still Chairman of the Board in U.S. auto production.
(5) An often-overlooked segment of motor vehicle production is truck trailer and chassis work. One of the leading states for truck body and trailer manufacturing is Indiana. It’s noteworthy that Indiana is at the top of the chart for ‘concentration’ of durables manufacturing jobs in the accompanying table. Wisconsin, Michigan, Iowa and Ohio are the other states in the Top Five for ‘concentration’. (Wisconsin is number one in ‘concentration’ for durables and non-durables manufacturing combined.)
(6) Returning to a discussion of ‘flight’, two states – Washington (16.7%) and California (14.9%) – account for by far the largest shares of total U.S. ‘aerospace products and parts’ jobs. The next four in line are: Texas (9.7%); Connecticut (6.3%); Kansas (6.1%; and Arizona (5.7%).
(7) Furthermore, the states of Washington and California jointly provide nearly one-third of all U.S. ‘aerospace products and parts’ jobs.
Map 1: Top 12 – Rankings of States by Industrial Subsector Jobs – “Weight”
Share of Total U.S. Durables Manufacturing Jobs
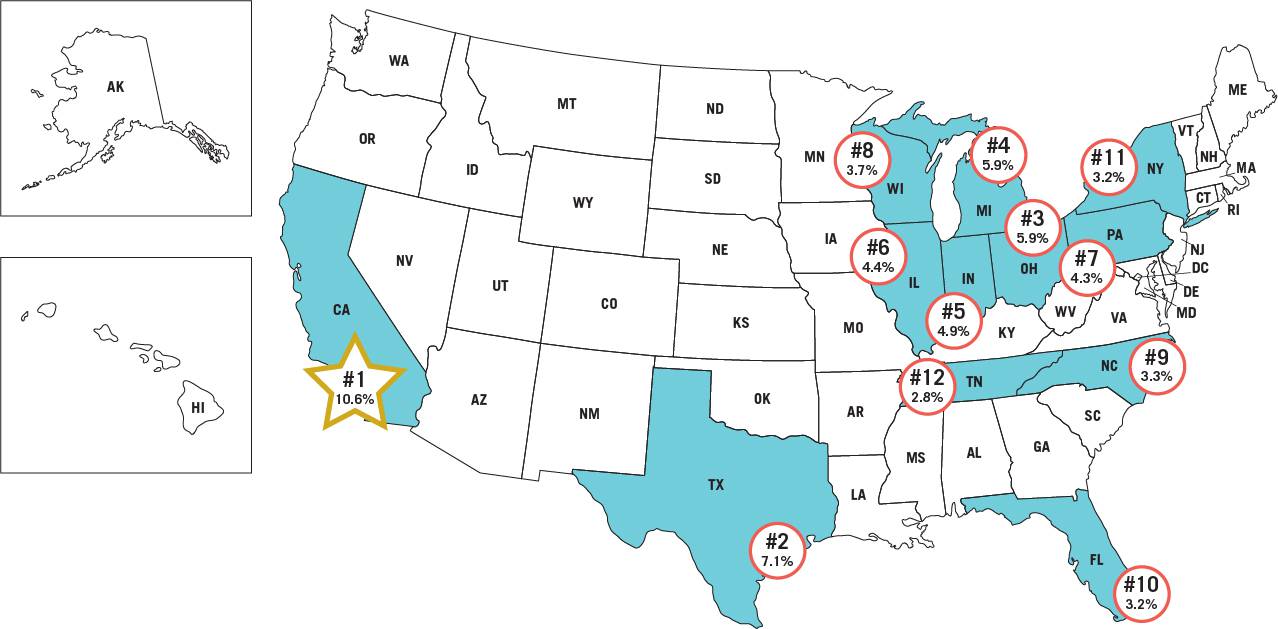
Data source: Bureau of Labor Statistics (BLS).
Graphic: ConstructConnect.
Map 2: Top 12 – Rankings of States by Industrial Subsector Jobs – “Concentration”
Durables Manufacturing Jobs Per Million Residents of the State
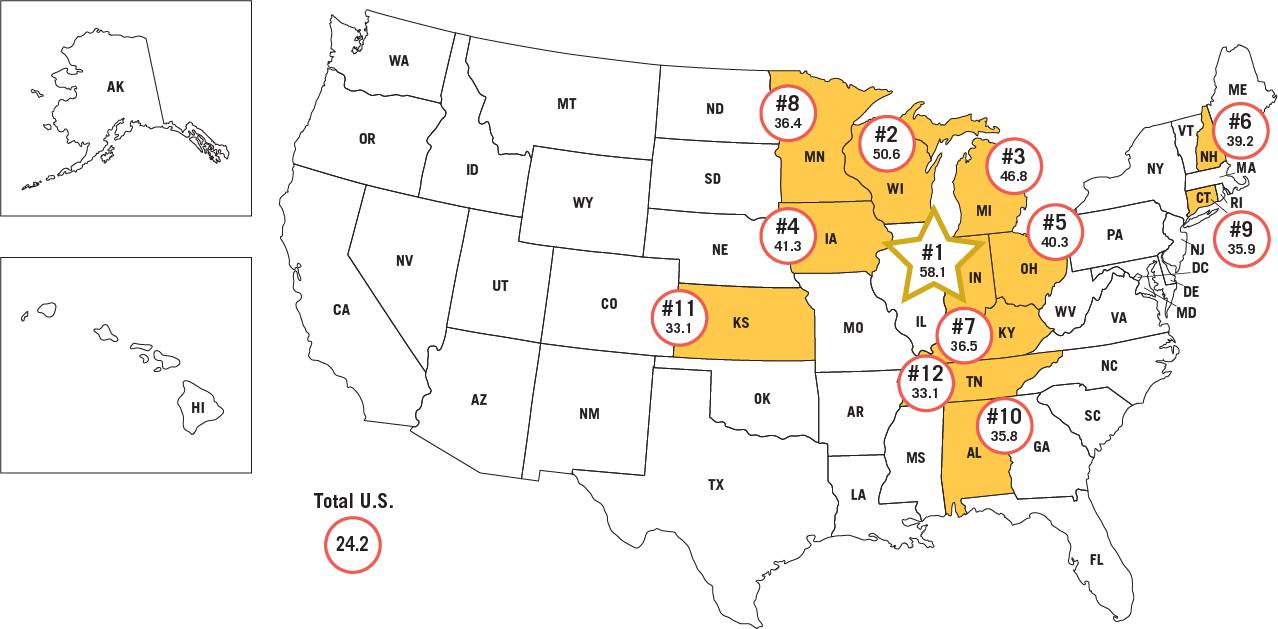
Total U.S. number of durables manufacturing jobs per million population is 24.2.
Data source: Bureau of Labor Statistics (BLS).
Graphic: ConstructConnect.
Tables: Ranking of States by Durables Manufacturing Jobs
| Table 1: Weight: | Table 2: Concentration: | ||||||
| Share of Total U.S. | DURABLES MANUFACTURING Jobs | ||||||
| DURABLES MANUFACTURING Jobs | Per Million Residents of the State | ||||||
| 1 | California | 10.6% | 1 | Indiana | 58.1 | ||
| 2 | Texas | 7.1% | 2 | Wisconsin | 50.6 | ||
| 3 | Ohio | 5.9% | 3 | Michigan | 46.8 | ||
| 4 | Michigan | 5.9% | 4 | Iowa | 41.3 | ||
| 5 | Indiana | 4.9% | 5 | Ohio | 40.3 | ||
| 6 | Illinois | 4.4% | 6 | New Hampshire | 39.2 | ||
| 7 | Pennsylvania | 4.3% | 7 | Kentucky | 36.5 | ||
| 8 | Wisconsin | 3.7% | 8 | Minnesota | 36.4 | ||
| 9 | North Carolina | 3.3% | 9 | Connecticut | 35.9 | ||
| 10 | Florida | 3.2% | 10 | Alabama | 35.8 | ||
| 11 | New York | 3.2% | 11 | Kansas | 33.1 | ||
| 12 | Tennessee | 2.8% | 12 | Tennessee | 33.1 | ||
Total U.S. number of durables manufacturing jobs per million population is 24.2.
Data source: Bureau of Labor Statistics (BLS).
Tables: ConstructConnect.


Recent Comments
comments for this post are closed