
Construction spending in various type-of structure categories is driven by economic circumstances within specific industrial subsectors. For example, manufacturers set the pace in industrial construction.

Good health in the leisure and hospitality sector provides the backing for new hotel and motel work. And jobs levels in information and financial services, as well as in more rapidly expanding fields of endeavor such as computer systems and design services, establish the need for additional office space and commercial tower square footage. (See, "Shifts in Office Jobs and Implications for Commercial Tower Construction".)
This article is the seventh, or final one, in a series of seven that examines key industrial sectors to determine where they are most prominent regionally. Rankings of state strength in each industrial sub-sector are based on both ‘weight’ and ‘concentration’ of relevant employment.‘Weight’ is simply the number of jobs in the industrial sub-sector in each state. ‘Concentration’ is each state’s number of jobs in the sub-sector divided by the state’s population. In effect, it’s a ‘per capita’ figure, except that it’s expressed as number of jobs per million population.
By ‘weight’, the states with the largest populations are almost always high in the rankings. The rankings by ‘concentration’, however, often deliver a jolt of surprise or two.
State Tiers:
It’s important to know that three clear groupings of states emerge from an analysis of the Census Bureau’s latest (i.e., through July 1, 2018) population statistics. Those groupings are: (A) the four frontrunner states by nominal levels of population – California, Texas, Florida and New York; (B) the three states with the fastest year-over-year gains in population – Nevada, Idaho and Utah; and (C) another tier of six states with both strong nominal increases and percentage changes in resident counts over the past several years – Washington, North Carolina, Georgia, Arizona, Colorado and South Carolina. (See, “Latest State Population Statistics, Maps, & Tables – Six Dark Horse Winners“.)
Also read, “Series (1 of 7): Rankings of States by Industrial Subsector Jobs – Manufacturing“; “Series (2 of 7): Rankings of States by Industrial Subsector Jobs – Financial Services“; “Series (3 of 7): Rankings of States by Industrial Subsector Jobs – Information Services“; and “Series (4 of 7): Rankings of States by Industrial Subsector Jobs – Leisure and Hospitality“; "Series (5 of 7): Rankings of States by Industrial Subsector Jobs – Computer Systems Design"; and "Series (6 of 7): Rankings of States by Industrial Subsector Jobs – Durables Manufacturing".
State Leaders in Construction Sector Jobs – Highlights:
(1) America’s four biggest-population states (CA TX FL and NY) are also at the forefront when it comes to number of construction jobs. Counting more than 850,000 ‘hard hat’ workers among its labor pool, California is number one for ‘weight’ with an 11.9% slice of the 7.5 million U.S. total. Texas is not far behind, claiming a 10.6% share. Florida (7.5%) and New York (5.5%) are in third and fourth spots.
(2) I’m fond of pointing out that one in three Americans lives in California, Texas, Florida or New York. A similar story can be told concerning construction workers. A slightly more than one-third (35.5%) proportion of all U.S. on-site employees resides in CA, TX, FL or NY.
(3) While there are no Tier B states among the Top 12 on the ‘weight’ (i.e., left-hand) side of the table, mainly because they have low population bases, three of the six Tier C states pop up – North Carolina, Washington and Georgia. Through November of 2018, on a year-over-year basis, housing starts in North Carolina and Washington were up modestly; but in Georgia, they were ahead by a more substantial +17%.
(4) The importance of population growth to construction employment is made clear on the ‘concentration’ side of the table. All three Tier B states (i.e., those with the fastest year-over-year percentage changes in population) are among the Top 12 on the right-hand side of the table – Utah (with a 3rd-place ranking), Nevada (5th) and Idaho (8th).
(5) The populations of Colorado and Washington (both Tier B states) are also increasing rapidly and they are present in the best-dozen for ‘concentration’ on the right-hand side of the table. Washington, which is immersed in a high-tech boom, is the only state making it into the Top 12 for both ‘weight’ and ‘concentration’. Presently, quality job opportunities and plentiful construction cranes are two dominant features of Seattle-Tacoma in the Pacific northwest.
(6) Some of the other states with high-rankings for ‘concentration’ have been given boosts by especially large-project start-ups over the past couple of years. In North Dakota, it’s been wind-generated electric power and crude oil refinery work; in Utah, airport construction and a new Facebook data center; in Louisiana, a natural gas-powered electricity plant; in Nevada, an NFL football stadium and a new Apple data center; and in Colorado, a mega-sized wind power project.
(7) The map for concentration of construction jobs has one remarkable feature. Ten of the Top 12 states are contiguous (i.e., they have shared borders) in the west and north of the country. Eight of those 10 states have low populations of 3.2 million people or less each. The two exceptions are Washington (7.5 million) and Colorado (5.7 million). (Wyoming has the lowest population among all states, at 600,000.) Heavy industry and many services-supplying firms are hesitant to locate where there is no large labor pool. The consequence is that whatever work is available in construction becomes relatively more important.
Map 1: Top 12 – Rankings of States by Industrial Subsector Jobs – “Weight”
Share of Total U.S. Construction Jobs
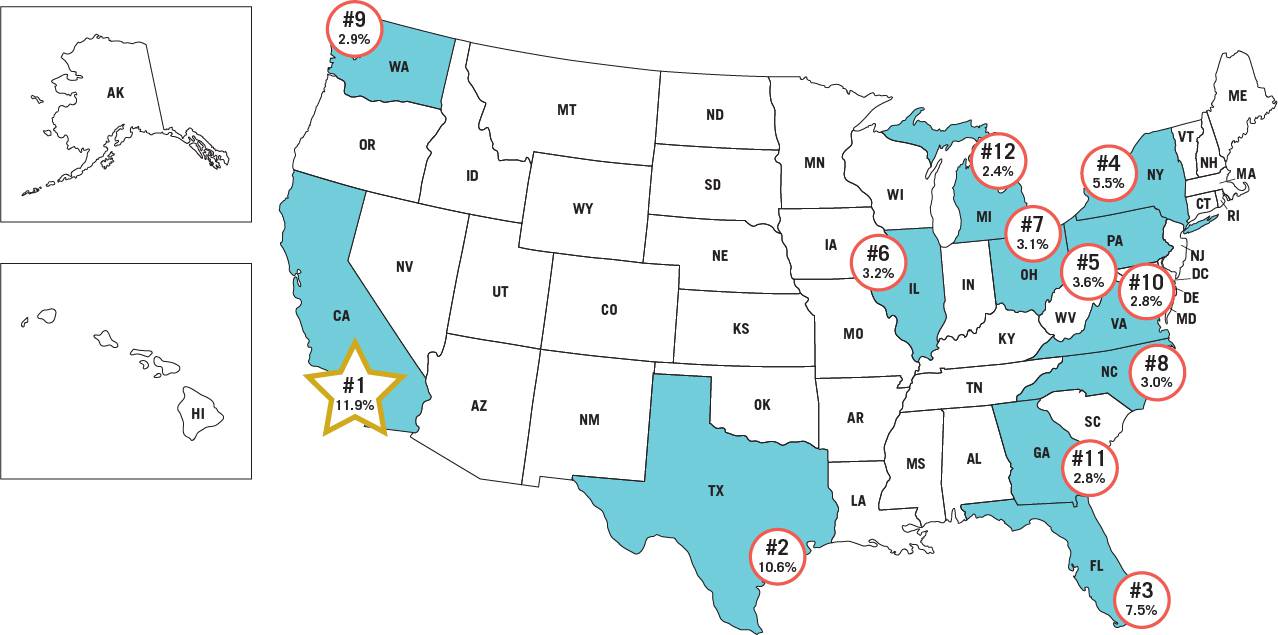
Data source: Bureau of Labor Statistics (BLS).
Graphic: ConstructConnect.
Map 2: Top 12 – Rankings of States by Industrial Subsector Jobs – “Concentration”
Construction Jobs Per Million Residents of the State
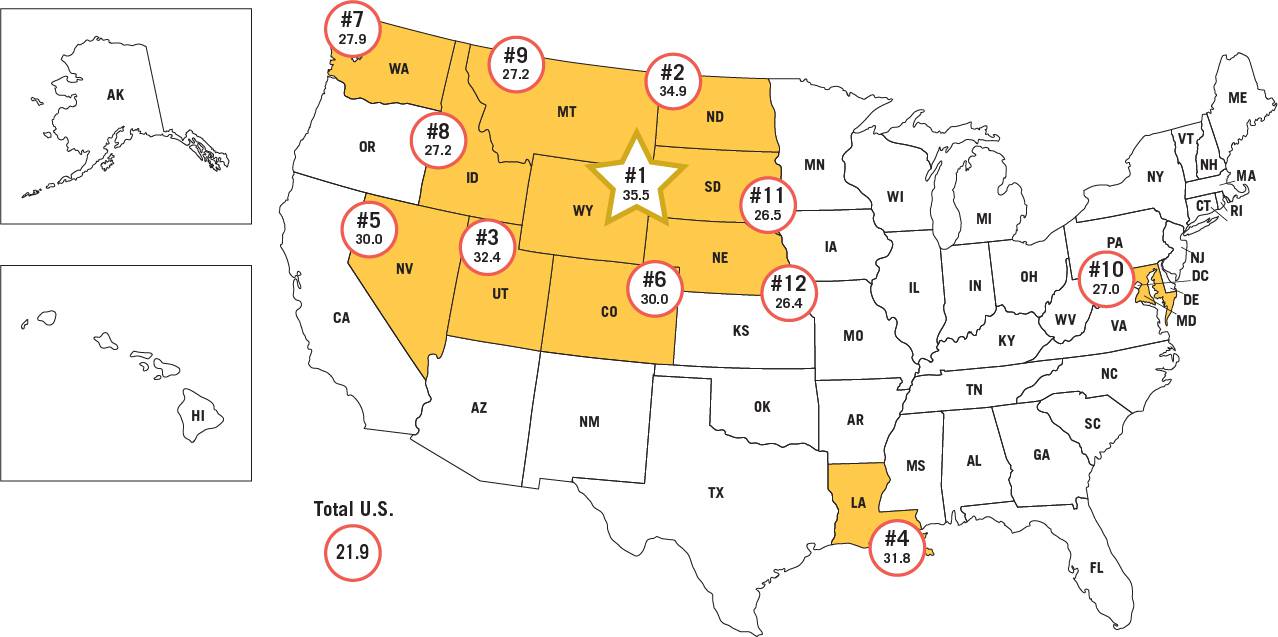
Total U.S. number of construction jobs per million population is 21.9.
Data source: Bureau of Labor Statistics (BLS).
Graphic: ConstructConnect.
Tables: Ranking of States by Construction Jobs
| Table 1: Weight: | Table 2: Concentration: | ||||||
| Share of Total U.S. | CONSTRUCTION Jobs | ||||||
| CONSTRUCTION Jobs | Per Million Residents of the State | ||||||
| 1 | California | 11.9% | 1 | Wyoming | 35.5 | ||
| 2 | Texas | 10.6% | 2 | North Dakota | 34.9 | ||
| 3 | Florida | 7.5% | 3 | Utah | 32.4 | ||
| 4 | New York | 5.5% | 4 | Louisiana | 31.8 | ||
| 5 | Pennsylvania | 3.6% | 5 | Nevada | 30.0 | ||
| 6 | Illinois | 3.2% | 6 | Colorado | 30.0 | ||
| 7 | Ohio | 3.1% | 7 | Washington | 27.9 | ||
| 8 | North Carolina | 3.0% | 8 | Idaho | 27.2 | ||
| 9 | Washington | 2.9% | 9 | Montana | 27.2 | ||
| 10 | Virginia | 2.8% | 10 | Maryland | 27.0 | ||
| 11 | Georgia | 2.8% | 11 | South Dakota | 26.5 | ||
| 12 | Michigan | 2.4% | 12 | Nebraska | 26.4 | ||
Total U.S. number of construction jobs per million population is 21.9.
Data source: Bureau of Labor Statistics (BLS).
Tables: ConstructConnect.


Recent Comments
comments for this post are closed