A decade ago, there was much alarmist talk about the U.S. twin-deficit problem, relating to Washington’s spending and foreign trade. Then for a while, both issues abated somewhat. The annual government deficit dropped below $1 trillion, touching down at -$600 billion, and the yearly trade shortfall pulled back from -$800 billion to less than -$600 billion.

Well, in case you’ve stopped following the news, they’re back in the headlines. In December, America’s trade deficit in goods and services (annualized) was -$717 billion. The goods alone (i.e., ‘merchandise trade’) deficit was a record -$978 billion, or nearly a negative trillion dollars. At the same time, the federal government’s expenditures-to-revenue imbalance is ballooning, returning to minus a trillion dollars. The national debt has climbed to a staggering $22 trillion.
With the nation’s unemployment rate so low (3.8%) and incomes rising (a +3.4% increase in ‘all jobs’ average hourly earnings in February), there’s underlying strong support for consumer spending in national output that should keep the economy moving forward. Nevertheless, it would be willful avoidance not to notice that some storm clouds are gathering on the horizon.
With the foregoing as backdrop, there are numerous other ‘nuggets’ to be gleaned from the latest private and public sector data releases on the U.S. and Canadian economies. A dozen of the most interesting developments are discussed below.
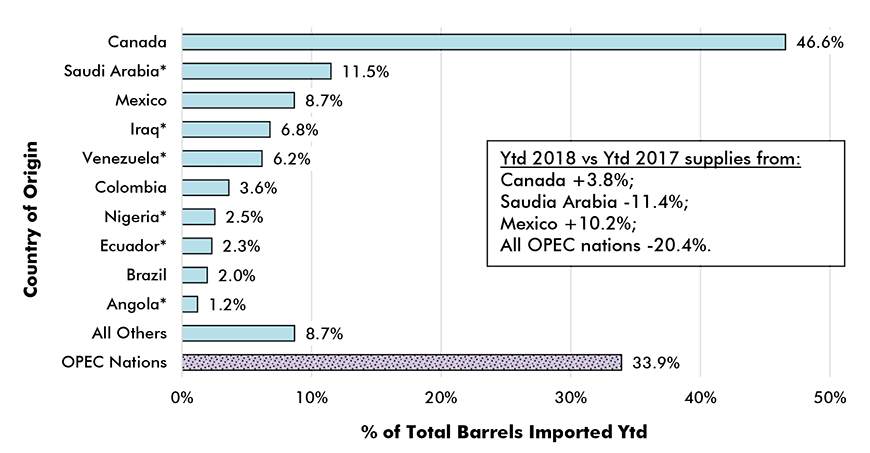
(1) From the 1970s into the early years of this century, much of the U.S. foreign trade problem was due to a reliance on outside sources of oil. Imports of crude accounted for as much as 40% of annual domestic demand. OPEC nations, and especially countries in the Middle East, were able to exert great leverage on the price of oil. Through extensive fuel-efficiency efforts, and a ramping up of production ‘at home’ (i.e., by tapping into shale rock reserves), U.S. dependency on foreign oil has fallen below one-fifth of total demand. And as Graph 1 points out, Canada’s share of those imports (46.6%) vastly exceeds OPEC’s share (33.9%). The portion of the import pie coming from Middle Eastern OPEC nations is now less than 20%.
Graph 1: Foreign Sources of U.S. Imported Oil
% of Total Barrels Year to Date − December 2018

(2) In 2018, America’s year-over-year imports of foreign oil in number of barrels, by major supplier nations, were as follows: Canada, +3.8%; Saudi Arabia, -11.4%; Mexico, +10.2%; Iraq, -17.8%; Venezuela, -26.7%; and Colombia, -25.7%. Total crude imports, in barrels, were -6.2%. Forget energy! By far, the two biggest product-category contributors to the U.S. foreign trade deficit have become ‘consumer goods’ (one-half of the entire shortfall) and ‘automotive vehicles, parts and engines’ (one-quarter). And despite large imports of oil from Canada, the U.S. is close to having trade balance with its northern neighbor. The four major other-country or geographic-region sources of the U.S. trade deficit in the latest month (December 2018) were: China (50.7%), the Euro Area (18.6%); Mexico (10.6%); and Japan (7.8%).
(3) U.S. ‘retail and food services’ sales in January were tepid, +0.2% month-over-month (m/m) and +2.3% year-over-year (y/y). Falling gasoline prices have been investing total retail sales with a downwards bias. (Gasoline station sales in February were -4.2% y/y). The best y/y gains among shopkeepers and restaurant-owners in the latest month were realized by: ‘building material and garden equipment supplies dealers’, +8.7%; ‘food services and drinking places’, +5.4%; and ‘grocery stores,’ +3.5%. Non-store retailers (i.e., sellers over the Internet) rang up receipts that were +7.3% y/y.
(4) For February, the U.S. ‘All Items’ Consumer Price Index (CPI) was +1.5% y/y. The core rate of inflation, which leaves out food and energy items because they have a tendency towards extreme volatility, was +2.1%. The y/y change in U.S. gasoline prices in the latest month was -9.1%. Canada’s February inflation findings are not scheduled to be released until March 22nd. In January, the Canadian all-items CPI increase had been +1.4%, with ‘core’ at +1.9% and gasoline, -14.2%. While latest (Q4 2018) quarter-to-quarter ‘real’ (i.e., inflation-adjusted) gross domestic product (GDP) growth (annualized) in the U.S. was a still respectable +2.6%, Canada’s was a barely-making-headway +0.4%.
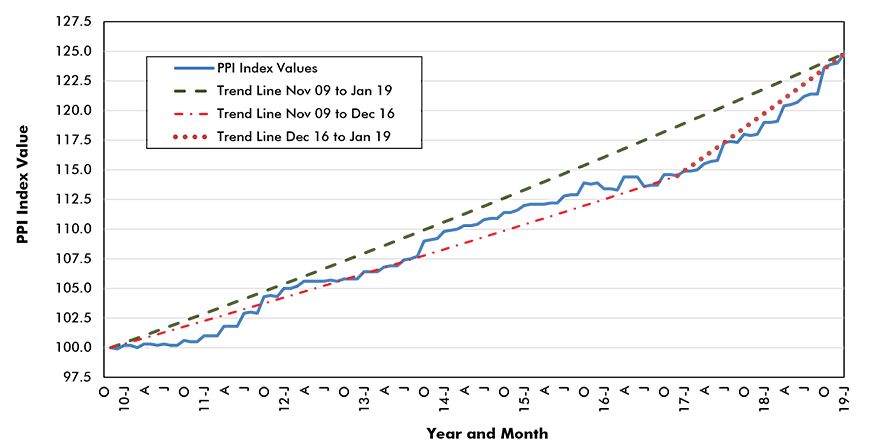
(5) Some of the best data on U.S. construction costing is to be found among the monthly Producer Price Index (PPI) series published by the Bureau of Labor Statistics (BLS). Graph 2 shows the PPI index for what is termed ‘final demand construction’. This is meant to capture the movement in construction costs experienced by owners when they undertake their capital spending projects. Unlike many other PPI series, which have long historical records and extend way back in time, calculation of the ‘final demand construction’ index began as recently as November 2009. The November 2009 actual dollar cost was set equal to 100.0 and subsequent monthly dollar levels have been expressed relative to November 2009’s figure, yielding index values that have increased to 125.0 by January of this year.
Graph 2: Final Demand Construction − U.S. Producer Price Index (PPI)

Annual (y/y) compounding rate along Nov 2009 to Jan 2019 trend line = 2.4%.
Annual (y/y) compounding rate along Nov 2009 to Dec 2016 trend line = 1.9%.
Annual (y/y) compounding rate along Dec 2016 to Jan 2019 trend line = 4.2%.
(6) Three trend lines have been positioned relative to the index series in Graph 2. They may look like straight lines, but they each have slight curvatures and that’s because they show exponential growth rates. As set out in the text box under the chart, moving from November 2009’s index value of 100.0 to January 2019’s index value of 124.8 has been equivalent to an annual compounding growth rate of +2.4%. But that’s not exactly how the index performed. Rather, it had a modest upward sloping pattern that prevailed from January 2000 to December 2016, which was equivalent to an annual compounding rise of +1.9%, then it shifted higher in a steeper fashion, climbing at a rate equivalent to +4.2% annually.
(7) Graph 2 highlights how the cost of construction has been heating up. The latest year-over-year increase in the ‘final demand construction’ PPI has been +4.9%. By types-of-structure, the sharpest cost increases have been for industrial buildings (+5.8% y/y), office buildings (+5.2%) and schools (also +5.2%). By comparison, the increasing cost of building a warehouse (+3.9%) has been less severe.
(8) Delving deeper into the latest (January 2019) PPI data, some of the most dramatic increases in construction material costs y/y have been as follows: asphalt, +31.9%; steel bars, plates and structural shapes, +23.7%; steel pipe and tube, +18.3%; paints and architectural coatings, +7.4%; precast concrete products, +6.8%; insulation materials, +6.4%; and aluminum mill shapes, +6.1%. While the PPI numbers measure the costs of building products from only domestic producers, and exclude imports, clearly there have been impacts on steel and aluminum prices from the new tariff regime.
(9) There have also been shifts towards ‘bargain’ pricing among PPI series, mainly in forestry products. Softwood lumber is -10.4% y/y; plywood, -3.8%; and particle board and oriented strand-board (OSB), -8.8%. The easing in the cost of lumber is despite heavy tariffs on Canadian imports and results from a weakening in housing start activity that should prove to be temporary, especially now that the upward climb in interest/mortgage rates has halted.
(10) Total housing starts in Canada in February slipped badly, to only 173,000 units seasonally adjusted and annualized (SAAR). In January, they had managed a level still a little above the 200,000-benchmark figure. Few analysts expect either the Federal Reserve or the Bank of Canada to make further tightening interest rate moves any time soon. Among Canada’s six largest-population centers, 2019 year-to-date housing starts (i.e., versus January-February 2018) have been: Ottawa-Gatineau, +34%; Calgary, +6%; Vancouver, -4%; Edmonton, -10%; Montreal, -12%; and Toronto, -46%.


Recent Comments
comments for this post are closed