GDP’s Underpinning from Housing Starts Weakens
The housing starts numbers that analysts key on are monthly ‘actual’ figures, in units, that have been seasonally adjusted and annualized (i.e., extrapolated to yield a yearly total). The acronym for such a calculation is SAAR − i.e., seasonally adjusted at an annual rate.
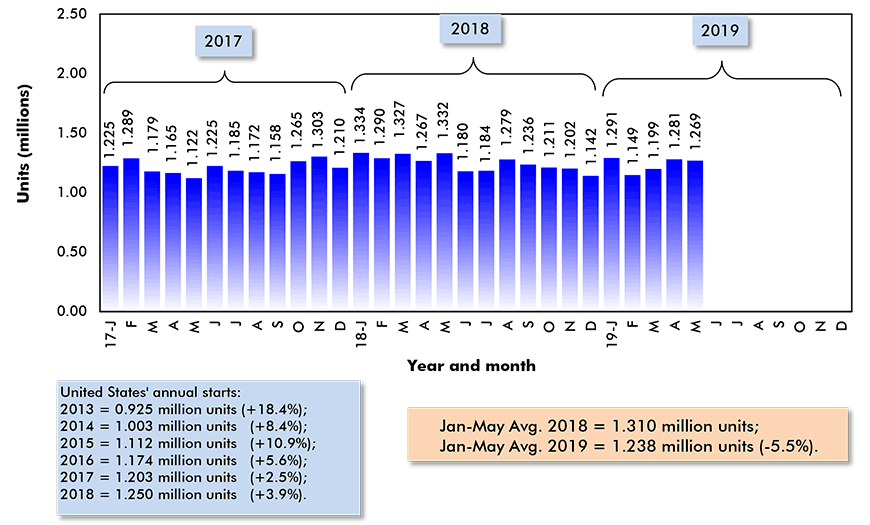
Based on demographic factors (e.g., population growth and the rate of family formations), with consideration also given to the pace of demolitions, the annual level of new home groundbreakings in the U.S. should currently be about 1.6 million units. That would be ideal.
Instead, and as is apparent from Graph 1, the monthly U.S. SAAR figure has been mainly stuck near 1.3 million units for the past several years.
U.S. national housing starts through May of this year, 2019, have averaged only 1.238 million units SAAR, a decline of -5.5% versus the first five months of 2018. To place this in a historical context, there has not been a decline in the annual level of U.S. housing starts since 2009.
To further elaborate, a record-long ten-year expansion in the economy has been enabled by a similarly lengthy period of year-to-year positive changes in housing starts.
Sustained strength in new home construction is often a mainstay of GDP growth. When it is absent, nagging worries begin to surface about the economy’s ability to maintain good prospects.
The Federal Reserve is aware of this dynamic and it’s undoubtedly one of the reasons the nation’s central bank has become more ‘dovish’ on interest rates.
Graph 1: U.S. Monthly Housing Starts
Seasonally Adjusted at Annual Rates (SAAR)
Data source: U.S. Census Bureau (Department of Commerce).
Chart: ConstructConnect.
Among Regions, Only the South Making a Home Starts Gain in 2019
The year-over-year change in average monthly mutiple-unit starts so far in 2019, at -7.4%, has been worse than for single-family starts, -4.7%. Multi-unit starts counts are based on new dwellings in apartment buildings and condominium towers. One tall tower can contain hundreds of units.
One encouraging feature of multi-unit starts so far in 2019 is that they have managed an increase in each successive month since January. Singles have turned in a little more checkered performance, up one month then down the next.
Through May 2019, the singles’ share of U.S. total housing starts has been slightly more than two-thirds (69.3%). On the flip side, multiples have accounted for a little less than one-third (30.7%).
Regionally, only the South has achieved an increase in starts to date in 2019, +3.5%. The declines in the other regions run from -8.7% in the Northeast to -16.8% in the West, with the Midwest in between at -12.9%.
The South (54.1%) has accounted for more than half of total starts through May of this year. The West is next in prominence, at exactly one-quarter (25.0%). The Midwest has a 12.4% share and the Northeast, 8.5%.
Graph 2: U.S. Housing Starts
Jan-May 2019 vs Jan-May 2018 % Change
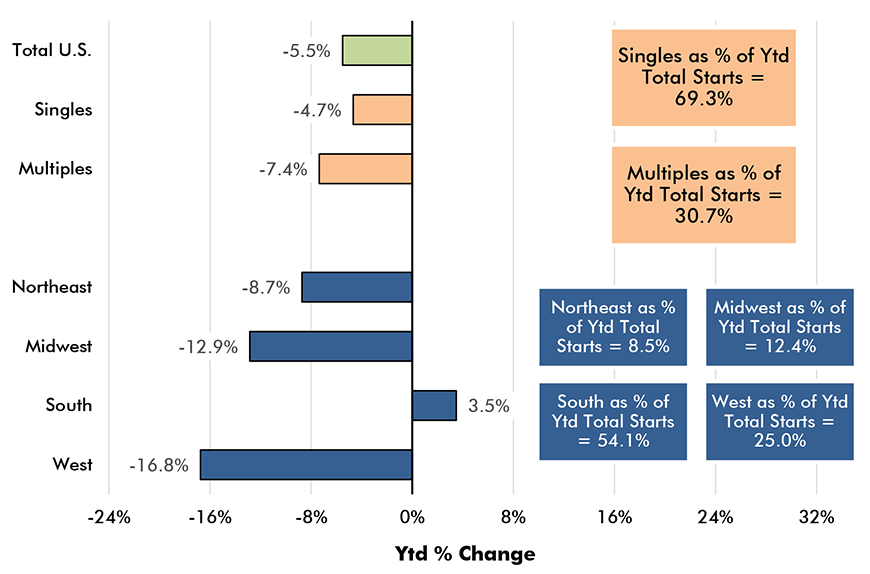
Based on averages of monthly seasonally adjusted and annualized (SAAR) unit starts.
Data source: U.S. Census Bureau.
Chart: ConstructConnect.
Canada’s Total Housing Starts -7.7% Year to Date
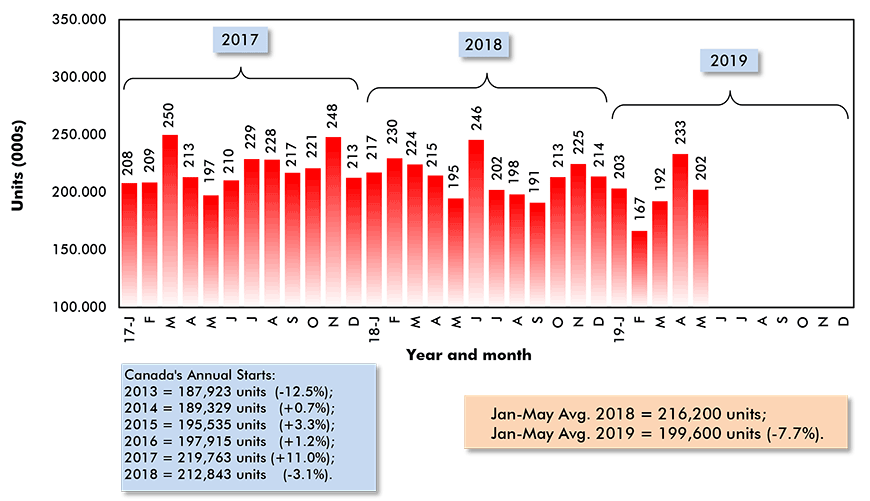
Canada’s annual housing starts have hovered close to 200,000 units for a decade.
Therefore, with each monthly announcement of housing starts from Canada Mortgage and Housing Corporation (CMHC), there’s keen interest in how the latest figure compares with the 200,000 ‘standard’.
In four of the first five months of 2019, 200,000 units (SAAR) was either exceeded or almost met. February, however, registered a big dip, to only 167,000 units.
Mainly due to February’s plunge, average monthly housing starts in Canada so far this year, at 199,600 units, have been -7.7% versus the 216,200 units achieved from January-to-May of last year.
Runaway home price increases in some of Canada’s major urban centers, especially in Toronto and Vancouver, sparked government action to tighten mortgage approvals, limit the participation of foreign buyers in local real estate markets and, as an overriding goal, reduce purchases made as speculative plays.
The measures have been working. Where prices were molten hot before, they’ve cooled considerably. The jury is still out, however, on whether the current correction will slide too far in the wrong direction.
Graph 3: Canada Monthly Housing Starts
Seasonally Adjusted at Annual Rates (SAAR)
Data source: Canada Mortgage and Housing Corporation (CMHC).
Chart: ConstructConnect.
Ottawa-Gatineau Having Standout Housing Starts Results in 2019
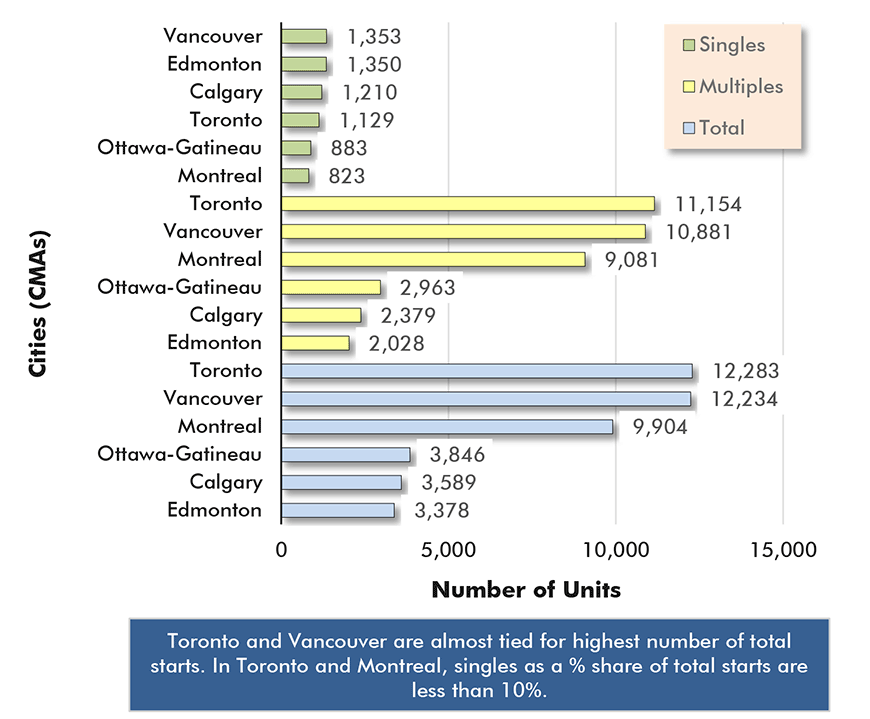
From Graph 4, Vancouver (1,353 units) is 2019’s year-to-date leader in single-family housing starts, among Canada’s six most populous cities. Edmonton (1,350 units) is nipping at Vancouver’s heels.
Moving on to multiple-unit starts, Toronto is edging out Vancouver for top spot, 11,154 units to 10,881. Toronto is also ahead of Vancouver in total starts, 12,283 to 12,234, although the margin of one-upmanship is slim. Montreal has a solid third-place ranking in both multi-unit (9,081) and total (9,904) starts.
Most noteworthy concerning housing starts in Canada’s biggest cities is the degree to which mutiple-unit projects, and especially condos, have a grip on the new housing construction scene. As a percent share of total starts, multiples in Montreal are 91.7%. In Toronto and Vancouver, they’re nearly as dominant, 90.8% and 88.9% respectively.
The city starts numbers quoted above come from ‘actuals’, not SAAR figures. There are results from seven more months still to be chalked up before annual or yearend results will be known.
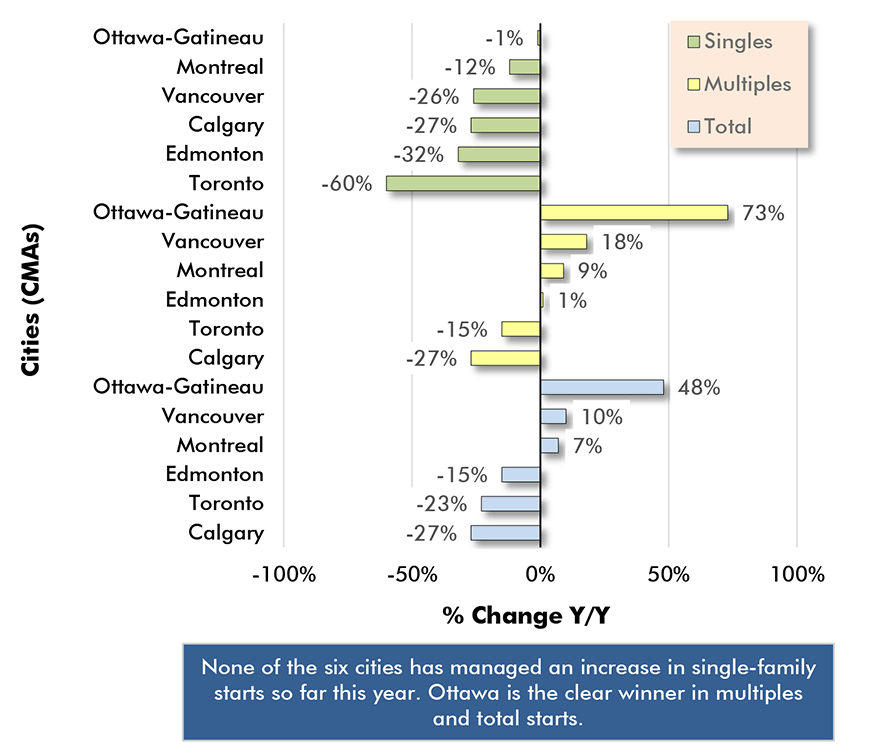
What is obvious and impressive, however, is Ottawa-Gatineau’s standout performance in new home groundbreakings on a percentage-change basis. From Graph 5, the nation’s capital is about even (-1.0%) in single-family starts, +73% in muliples and +48% in total.
The other five cities shown in Graph 5 all have negative records in single-famly starts, and far less positive, or straying-to-the-left-of-the-zero-axis results, for multiple-family and total starts.
Graph 4: Housing Starts in Canada’s 6 Most Populous Cities
Jan-Mar 2019 Actuals
Data source: Canada Mortgage and Housing Corporation (CMHC).
Chart: ConstructConnect.
Graph 5: Housing Starts in Canada’s 6 Most Populous Cities
Jan-May 2019 vs Jan-May 2018
Data source: Canada Mortgage and Housing Corporation (CMHC).
Chart: ConstructConnect.




Recent Comments
comments for this post are closed