Indices Moving Mainly Sideways
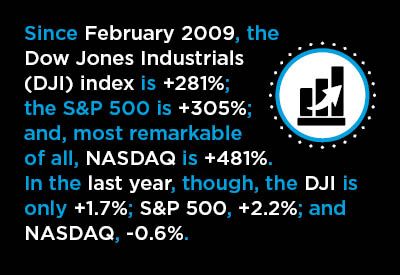
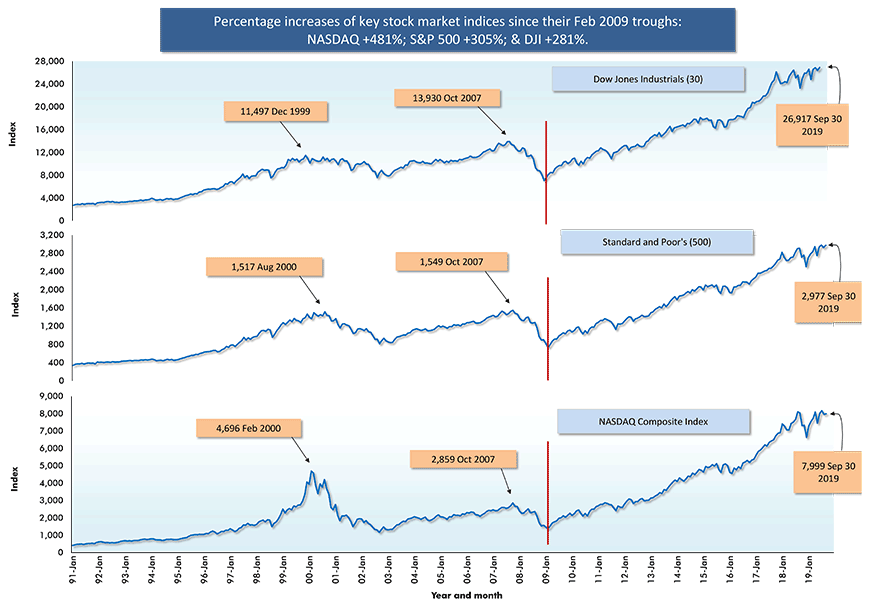
Relative to their trough levels in February 2009, when the recession was creating its greatest havoc, the three major U.S. stock market indices have risen to an astonishing degree. Presently (i.e., as of September 2019’s closing bell), the Dow Jones Industrials (DJI) index is +281%; the S&P 500 is +305%; and, most remarkable of all, NASDAQ is +481%.
It’s easy to be bedazzled by the steep slopes of the curves beyond the red vertical lines (which mark turning points from recessionary lows) appearing in Graph 1. If one concentrates on the late-stage performances of the curves, however, the results no longer seem as impressive. There has been a dampening of the slopes of all three curves since January 2018.
From Table 1, the latest year-over-year improvement in the S&P 500 has been only +2.2%, while the DJI has been even more lethargic, at +1.7%, and NASDAQ has slipped a tiny notch, -0.6%.
In July of this year, the indices did quite well, approaching their all-time highs, then they retreated somewhat in August, but came roaring back in September. Nevertheless, media buzz last month about how close the DJI and S&P 500 were to setting new records was a distraction from a hard truth. The indices have been mainly moving sideways for at least 12 months.
There is much speculation that the U.S. economy is heading towards a turning point, with thoughts of a slowdown or next recession looming large. Add to the list of early warning signs ‒ which include on-again-off-again yield curve inversions; a weak foreign trade position; a manufacturing sector in contraction; and burgeoning consumer and government debt – a stock market that has become far less sure of its optimistic footing.
(See also “13 Yellow Flags ‒ Warning Signs Concerning the U.S. Economy“.)
Securities Dealers Automated Quotations (NASDAQ), Reuters & Yahoo.
Chart: ConstructConnect.
| INDEX | 52-WEEK LOW | 52-WEEK HIGH | YEAR AGO (SEP 28, 2018) |
MONTH AGO (AUG 30, 2019) |
Latest Month-end Closing Prices (sep 30, 2019) |
PER CENT CHANGE, LATEST VERSUS |
|||
| 52-WEEK LOW | 52-WEEK HIGH | YEAR AGO | MONTH AGO | ||||||
| Dow Jones Industrials NYSE (^dji) |
Dec 26 18 21,713 |
Jul 16 19 27.399 |
26,248 | 26,403 | 26,917 | 24.0% | -1.8% | 1.7% | 1.9% |
| S & P 500 NYSE (^gspc) |
Dec 26 18 2,347 |
Jul 26 19 3,028 |
2,914 | 2,926 | 2,977 | 26.8% | -1.7% | 2.2% | 1.7% |
| NASDAQ (^ixic) |
Dec 24 18 6,190 |
Jul 26 19 8,340 |
8,046 | 7,963 | 7,999 | 29.2% | -4.1% | -0.6% | 0.5% |
| S & P/TSX Composite TSX (^gsptse) |
Dec 24 18 13,777 |
Sep 20 19 16,947 |
16,073 | 16,442 | 16,659 | 20.9% | -1.7% | 3.6% | 1.3% |
Securities Dealers Automated Quotations (NASDAQ), Toronto Stock Exchange (TSE) and Reuters.
Table: ConstructConnect.
The Racehorse ‒ NASDAQ
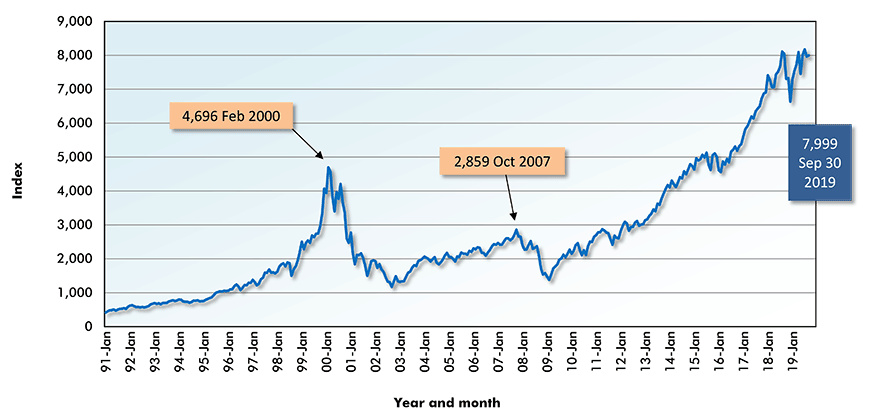
The racehorse among stock market indices has been NASDAQ. At a current level close to 8,000, it is up nearly six-fold versus its February 2009 bottom of 1,378. The high-tech sector has been a primary driver of growth for the U.S. economy over the past ten years. Firms in the sector, along with their investors, have reaped corresponding rewards.
There are indications of significant change about to sweep over some of the major players in the space, however. The Federal Trade Commission (FTC) has been scrutinizing Facebook regarding anti-trust violations and several of the top contenders for Democratic Party leadership in the next Presidential election have called for break-ups of FB, Amazon and Alphabet/Google.
The contention is that those giants have the means to limit competition and that they engage in practices that violate the privacy of their customers.
On another front, a federal appeals court has just ruled that the Trump Administration’s efforts to repeal ‘net neutrality’ can go ahead. Henceforth, big internet providers (e.g., Comcast and AT&T) will be able to offer tiered services. They’ll be able to charge more for better quality offerings ‒ for example, tied to speed of delivery.
Digital start-up companies in the fields of retail sales and entertainment streaming worry that their access to potential customers may be restricted. Established firms may not be affected much, since they’ll likely be able to negotiate volume discounts.
Securities Dealers Automated Quotations (NASDAQ), Toronto Stock Exchange (TSE) and Reuters.
Chart: ConstructConnect.
The Plodder ‒ TSX
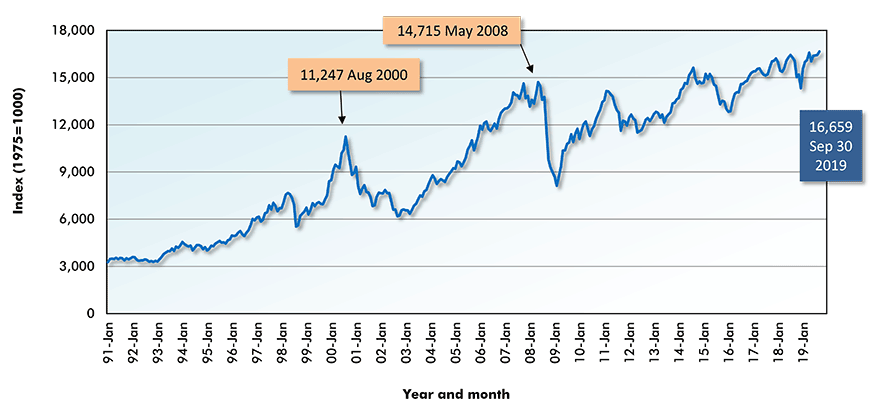
The plodder among North American stock market indices has been the Toronto Stock Exchange (TSX). NASDAQ’s figure may now be six times what it was at its low point in February 2009, but the TSX has barely doubled (+105%) since then.
Known for its resource sector enterprises, which thrive or perish on commodity demand and pricing, the TSX has languished along with a world trading environment that has failed to revive as hoped over a ‘lost’ decade.
Just the same, the TSX has just turned in the best year-over-year result, at +3.6%, among the four major North American stock market indices highlighted in Table 1. It seems the TSX is being rewarded for Canada’s outstanding +3.7% ‘real’ (i.e., adjusted for inflation) gross domestic product (GDP) growth rate in Q2 of this year. The +3.7% was quarter to quarter annualized. The U.S. comparable rate of change was +2.0%.
Also, more positive attention was paid to Canada’s reliable energy sector when a fire-sparking drone strike on Saudi Arabia’s oilfields caused a temporary spike in the global price of crude.
Toronto Stock Exchange
Securities Dealers Automated Quotations (NASDAQ), Toronto Stock Exchange (TSE) and Reuters.
Chart: ConstructConnect.
Troubles on the Asia Equities Front
Earlier this year, the major North American indices (i.e., except for the small-cap Russell 2000) were often the only ones, in prior versions of Table 2, with horizontal bars shooting out on the right-hand side of the 0.0% axis. In other words, they stood alone with plus percentage-change records. All the other indices from around the world were stuck with negatives.
Presently, there is more diversity. The Shanghai Composite (+3.0%), STOXX Europe (+2.6%) and DAX 30 (+1.5%) have joined the TSX (+3.6%), S&P 500 (+2.2%) and DJI (+1.7%) in upwards progress. Note, though, that even the best increase (+3.6% for the TSX) is nothing to ‘send an e-mail or text message home about’. A gain of less than +4.0% is not that impressive.
Among the indices with the worst year-over-year percentage-change numbers are three from across the Pacific: iShares Emerging Markets Asia, -6.0%; Hong Kong’s Hang Seng, -6.1%; and the Tokyo Nikkei, -9.8%.
To infer from the Shanghai Composite’s +3.0% and the Hang Seng’s -6.1% that all is well in mainland China relative to a struggling Hong Kong would be erroneous. The trading that makes up the Shanghai index is formally structured and determined by the institutional buying and selling of large blocks of equities. It features a stodginess that is in marked contrast to the lively interplay that occurs among large and numerous small investors in free-enterprise economies, including Hong Kong.
Beijing and Hong Kong have been at loggerheads for months, characterized by fierce protests in the latter domain. The citizens of Hong Kong are demanding that there be no further erosions of their independence.
Beijing needs Hong Kong. Hong Kong is the entry point for much of the foreign investment that ultimately winds up in partnership with Chinese firms inland. Moving in the other direction, China’s largest firms will often list on Hong Kong’s exchange as a first step to going international.
Year over Year as of Month-end Closings, Sep 2019
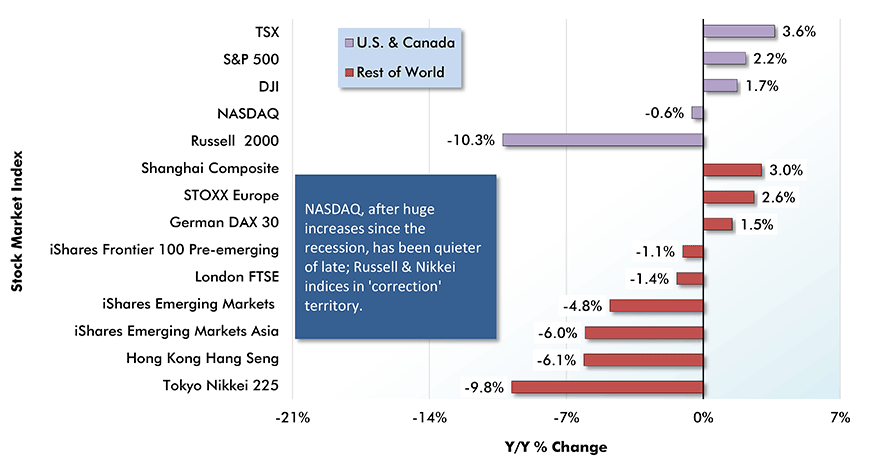
Table: ConstructConnect.
China has a Passel of Problems
The protests in Hong Kong, if they are too severely squelched, threaten to blow up into a full-scale public relations crisis for China’s President, Xi Jingping. Mr. Xi has eliminated the two-term limit on his presidency, but as in all political circles, there are sure to be individuals among China’s ruling elite who will be on the lookout for opportunities leading to personal advancement.
China is trying to transition from an export-based and big-government economy to one grounded more in consumer purchases. That hasn’t happened quickly enough and legacy issues have been lowering the nation’s GDP advance. (+6.0% annually has long been the official figure, but that’s almost surely an overstatement.)
Export sales are being restrained by China’s ongoing trade war with the U.S. The two nations are about to enter a 13th round of negotiations to deal with America’s complaints. The U.S. wants greater access to China’s marketplace and better protection for its intellectual property, as American companies work with Chinese firms.
Concerns about industrial espionage accompanying Chinese foreign investment have led to trade conflicts with other nations as well, including Canada.
The Chinese growth model since the mid-00s has feature massive spending on infrastructure projects. Now that some of those projects have been built, cost-benefit analysis is providing troubling statistics. In some instances, including big highway, bridge and transit undertakings, usage isn’t meeting expectations. Revenue isn’t proving commensurate with expenditures.
There’s a fundamental flaw in the way business is conducted in China. Government banks loan money to government companies to hire government contractors, with the whole entangled web overseen by government regulators. The potential for loans to balloon higher and be extended for longer periods than warranted is impossible to contain.
China’s debt-to-GDP ratio may be as high as 300% according to some published reports.


Recent Comments
comments for this post are closed