
Disappointing M/M Employment Results
According to August’s Employment Situation report from the Bureau of Labor Statistics, the total number of jobs in the U.S. economy in the latest month rose by +1.4 million and the seasonally adjusted (SA) unemployment rate decreased to 8.4% from 10.2% in July.

The not seasonally adjusted (NSA) unemployment rate in August was 8.5%, down from 10.5% the month before. The total number of unemployment individuals in America is now 13.6 million. In August of last year, the figure was 6.0 million.
The increase of +1.4 million jobs was a slowing from +1.7 million in July and +4.8 million in June.
The headline numbers on jobs gain and jobless rate are probably going to be greeted with enthusiasm. It’s somewhat disappointing, though, that the percentage increases in jobs month to month for most industrial sectors aren’t more upbeat. Base or ‘denominator’ levels for the calculation are quite low.
Total employment was just +1.0% month to month in August (and -6.8% year over year).
Private services providing jobs were likewise +1.0% m/m (-7.8% y/y).
Employment in manufacturing and construction only inched ahead in August, by +0.2% m/m for both sectors. On a year-over-year basis, jobs in manufacturing were -5.6% and in construction, -3.9%.
‘Leisure & Hospitality’ Jobs the Big Story
The month-to-month and year-over-year jobs performances in other key sectors were as follows:
- Retail trade, +1.7% m/m and -3.8% y/y;
- Transportation and warehousing, +1.5% m/m and -5.7% y/y;
- Professional and business services, +1.0% m/m and -6.1% y/y;
- Financial activities, +0.4% m/m and -1.3% y/y (i.e., the smallest y/y decline among all sectors);
- Information services, +0.6% m/m and -9.8% y/y;
- Education and health, +0.6% m/m and -4.7% y/y;
- Government, +1.6% m/m and -3.2% y/y;
- Leisure and hospitality, +1.4% m/m and -23.2% y/y.
‘Leisure and hospitality’, with its -23.2% y/y result, has been shown last for emphasis. The shrinkage of jobs in this sector has become the number one story of the pandemic and the current recession.
Many of the people who work in bars and restaurants and hotels and motels are low wage earners to begin with and they can ill afford to go long without incomes. They are the ones for whom a knock at the door carries the scary prospect of an eviction. A stock market that is booming and residential real estate that is heating up are worlds away from what they are experiencing.
The +1.4% advance in ‘leisure and hospitality’ jobs, month to month in August, was a marked deceleration from gains of +5.2% in July, +19.9% in June and +16.4% in May. (April, of course, was when the hammer fell, with ‘leisure and hospitality’ jobs evaporating by -47.0% m/m.)
Table 1: Monitoring the U.S. Employment Recovery – August 2020
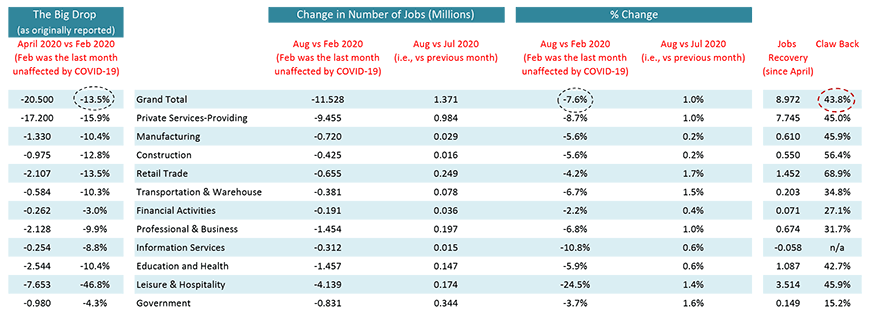
Chart: ConstructConnect.
‘Claw-Back’ Ratio Still Less than 50%
Table 1 above records the degree to which the big drops in U.S. jobs that occurred in March and April, due to coronavirus-related shutdowns, have been recovered.
Compared with February (the last month unaffected by COVID-19), U.S. total employment in April was -13.5%. Presently, with August numbers now available, the shortfall in total American jobs versus February is -7.6%. Therefore, the claw-back ratio ‒ i.e., the percentage of the plunge in jobs that has been recovered ‒ is 43.8%. (After July’s jobs report, it had been 37.3%.)
The claw-back ratio in manufacturing is 45.9% and in construction, 56.4%.
Retail trade has a strong jobs-recovery ratio of 68.9%.
Government’s jobs-recovery ratio is only 15.2%, but its decline in employment in the spring was relatively minor, -4.3%. Also, hiring by government in August set a torrid pace, +344,000 net new positions.
The U.S. construction sector’s NSA unemployment rate in August was 7.6%. In August of last year, it had been 3.6%.
Taking the ‘Rosy’ out of the Put-in-place Construction Statistics
The ‘high-level’ numbers from the Census Bureau on U.S. put-in-place construction activity are presenting too rosy a picture. Put-in-place capital spending is analogous to progress or work-in-process payments as projects proceed. Therefore, current PIP numbers include a lot of carryover work that was initiated some time ago.
Year-to-date PIP spending in July remained buoyant at +4.2% versus the first seven months of 2019. Residential year to date was +6.5% and nonresidential, +2.6%.
A better reading on more current conditions, however, can be obtained by comparing the latest three-month results with the prior three months, and annualizing the percentage change.
Adopting this methodology, PIP construction in the latest three months has been proceeding at a -14.9% pace for ‘total’, -24.3% for residential and -7.8% for nonresidential, with the background monthly numbers all being seasonally adjusted.
Finally, as a point of reference, ConstructConnect’s ‘grand total’ starts statistics in July were down by -20.4% year to date.
Alex Carrick is Chief Economist for ConstructConnect. He has delivered presentations throughout North America on the U.S., Canadian and world construction outlooks. Mr. Carrick has been with the company since 1985. Links to his numerous articles are featured on Twitter @ConstructConnx, which has 50,000 followers.


Recent Comments
comments for this post are closed