
You can probably learn more about what is happening in an economy by following patterns of employment than in any other way. This article dips below the surface numbers on the U.S. labor market and sets out the historical records of jobs levels in 28 sub-sectors.

An attempt has been made to arrange the graphed results for the 28 sub-sectors in a logical order.
Below are seven charts, each with a cluster of four graphs. The seven clusters or groupings deal with worker counts in: (1) resources; (2) manufacturing; (3) logistics and environmental matters; (4) hospitality and entertainment; (5) office-oriented; (6) institutional and real estate; and (7) ‘new wave’.
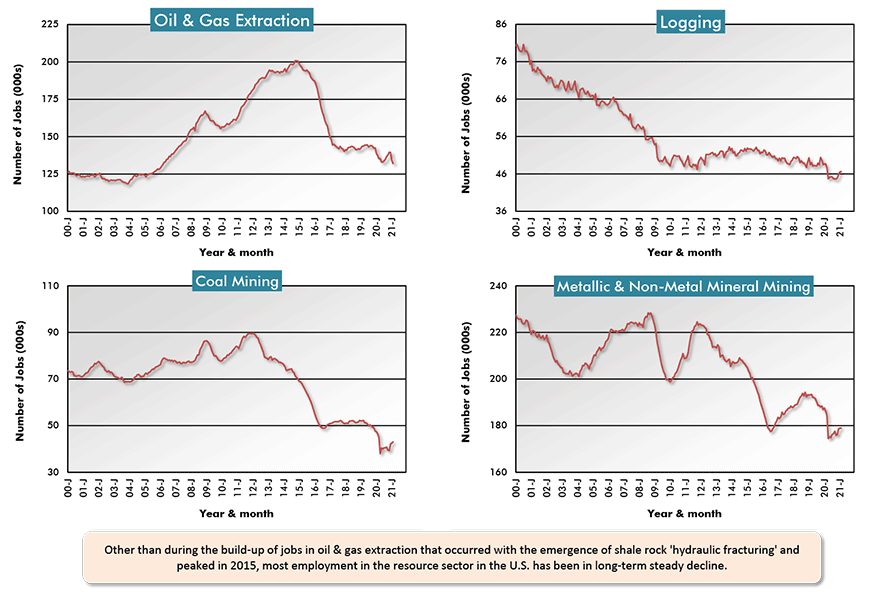
Minimal Jobs Creation in Resources
Based on the downward-sloping curves of the four graphs in Chart 1, the resource sector has not been the place to look for good jobs growth over the last decade-plus. Logging employment has particularly fallen into decline. Reduced throughput capacity at sawmills, reflected in drastic payroll cutbacks, is one of the reasons the cost of lumber has been soaring, now that housing starts have picked up significantly.
The extraction of oil and gas was a source of strong jobs growth from 2005 to 2015, when ‘hydraulic fracturing’ of shale rock for oil and natural gas was coming into its own in America. Excess supplies, however, soon led to a period of extreme price weakness. The per barrel cost of global crude even fell below zero for a short while last year. Hiring in the sector took a hike.
Nor will the Democrats gaining control of the White House and Congress be positive for oil and gas sector jobs. It will be hard to win approvals for pipeline expansions and new drilling ventures. (I think it’s fair to say the Dems are more environmentally sensitive than the GOP.)
There are three kinds of minerals: (1) energy (fossil fuels); (2) metallic; and (3) non-metallic. In Chart 1, there is a separate graph for employment in the fields of (2) and (3).
What are the differences between metallic and non-metallic minerals? Metallic minerals are generally shiny in their original form. They’re also ductile (pliable) and they’re more likely to be capable of conducting electricity. Included among metallic minerals are iron ore, aluminum, bauxite, copper, nickel, gold, silver and cobalt.
Prices for some metallic minerals have been experiencing lift-off lately, with gold being one standout.
Found among non-metallic minerals are sand, gravel, clay, salt, potash, diamonds and coal. Therefore, there is some double counting with both ‘coal mining’ and ‘non-metallic mineral mining’ included in Chart 1.
The concrete industry mainly draws inputs from among non-metallic minerals.
Charts: ConstructConnect.
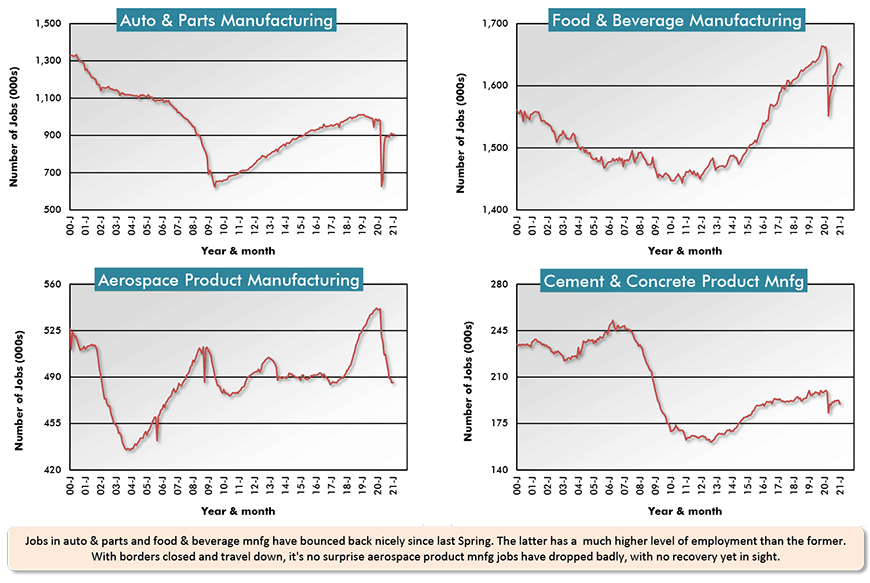
Manufacturing Jobs Bounce Back Nicely
The manufacturing job losses in the Spring of last year, when the coronavirus first picked a fight with the economy, were enormous. The number of auto and parts jobs dropped as low as in the previous trough. Food and beverage manufacturing jobs sank dramatically but stayed above their previous bottom level.
For both of those sectors, recoveries in employment were swift and dramatic. A fundamental shift in favor of online shopping boosted grocery store sales and prodded the demand for consumer staples, sometimes with the idea of stockpiling in mind.
Interestingly, there are far more jobs in food and beverage manufacturing than in auto making and parts production.
With borders closed and travel only a shadow of its former self, jobs in aerospace product manufacturing have dwindled, with no clear timeline evident on when they will return.
Charts: ConstructConnect.
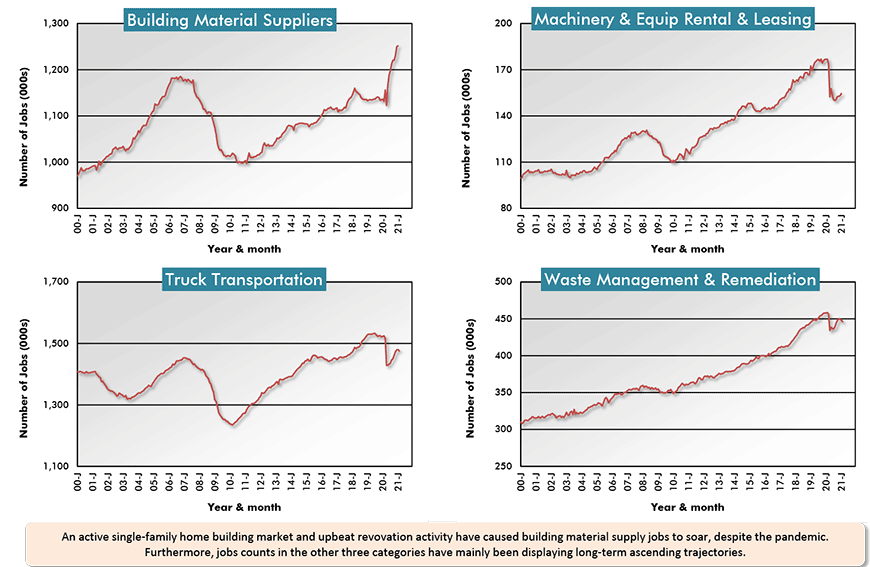
Bellwether Jobs in Logistics
The four sectors in Chart 3 have jobs performances that have been mainly climbing over at least the last ten years. Employment with building materials suppliers has been especially noteworthy, with a sharp spike apparent over the past year (while so many other sectors have been floundering).
Among the factors contributing to this strength have been a revival in single-family home construction and heightened renovation activity being undertaken by individuals who have shifted from their former office locations to carrying out their duties in their residences.
Two of the sectors in Chart 3 – ‘machinery and equipment rental and leasing’ and ‘truck transportation’ – because of their vast reach, are often considered (by economists and other analysts) to be bellwethers of how well the economy overall is doing. Both sectors hit rocky patches a year ago but are on the mend.
Coincident with the greatly increased interest in protecting the environment, jobs in ‘waste management and remediation’ have done almost nothing but increase since 2000.
Charts: ConstructConnect.
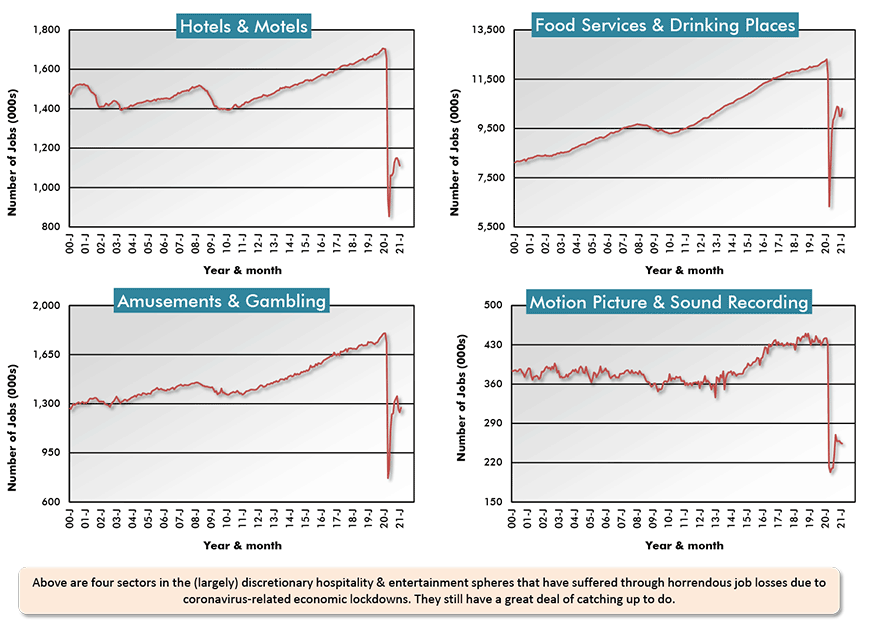
Entertainment is where the Jobs Picture’s Bleakest
Chart 4 is where the jobs picture turns truly ugly. Employment with ‘hotels and motels’, ‘food services and drinking places’, ‘amusements and gambling establishments’ and in ‘video production and sound recording’ tanked severely near the close of Q1 last year.
In all four instances, employment fell well below previous levels dating back to at least the turn of the century. Furthermore, jobs recoveries since then have been disappointing. Coronavirus infections coming in waves have delivered especially cruel impacts.
On several occasions, when it appeared health concerns were easing and a spate of re-openings might prove viable, hopes were soon dashed by new and more aggressive COVID-19 outbreaks.
As for 2021 jobs prospects in these four sectors, it’s the best possible news that vaccinations are finally underway and at an accelerated pace. There are preliminary signs that a turning of the corner, while it won’t be instantaneous, may be proceeding, nonetheless.
There are few among us who don’t crave some increased social and public engagement.
Charts: ConstructConnect.
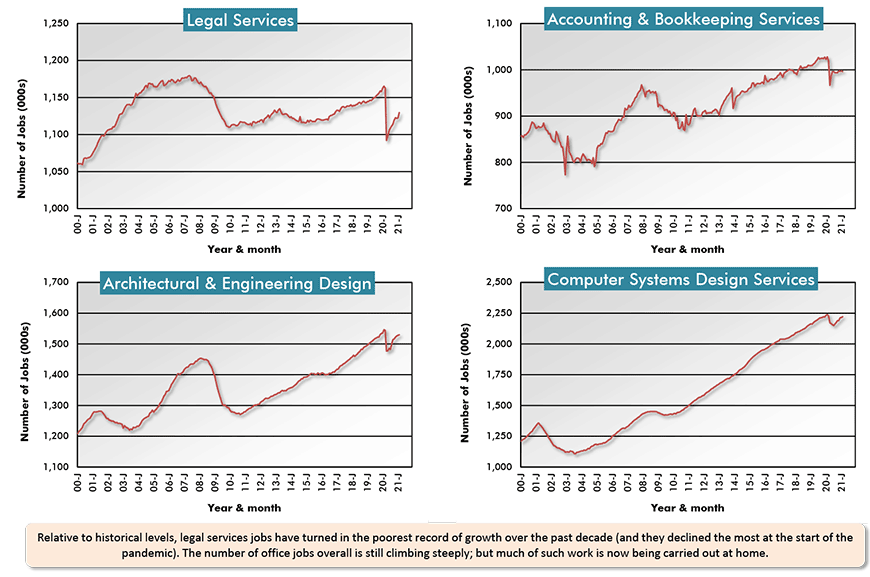
But Where will the ‘Office’ be Situated?
Chart 5 lays out employment in four categories of work that are traditionally carried out in an office building.
The number of legal services jobs declined mightily in February-April of last year. But their level has been rather flat for a long time, anyway, and was only just beginning to make a comeback before the floor gave way.
Jobs in ‘accounting and bookkeeping services’ and in ‘architectural and design services’ were displaying impressive upswings since shortly after the last recession in 2008-09, until being waylaid in the Spring of last year. The declines, however, were relatively minor and progress has been made in bringing staffing back to pre-coronavirus stances.
On an encouraging note, the Architecture Billings Index (ABI) calculated and published by the American Institute of Architects (AIA) reached a score of 53.3 in February of this year, the first time it’s been back above 50.0 ̶ indicating an improving work flow for design professionals ̶ since February of last year.
Many daily work activities were going digital before the pandemic. The process has speeded up even more over the latest 12 months. It’s no wonder that employment in ‘computer system design systems’ has moved progressively higher, with hardly any blips along the way.
For developers, though, the big question is going to be how many workers return to office towers come this summer and fall, as opposed to toiling away in their dens at home that they’ve taken care to outfit with printers, extra monitors, and the other accoutrements to serve them well.
Charts: ConstructConnect.
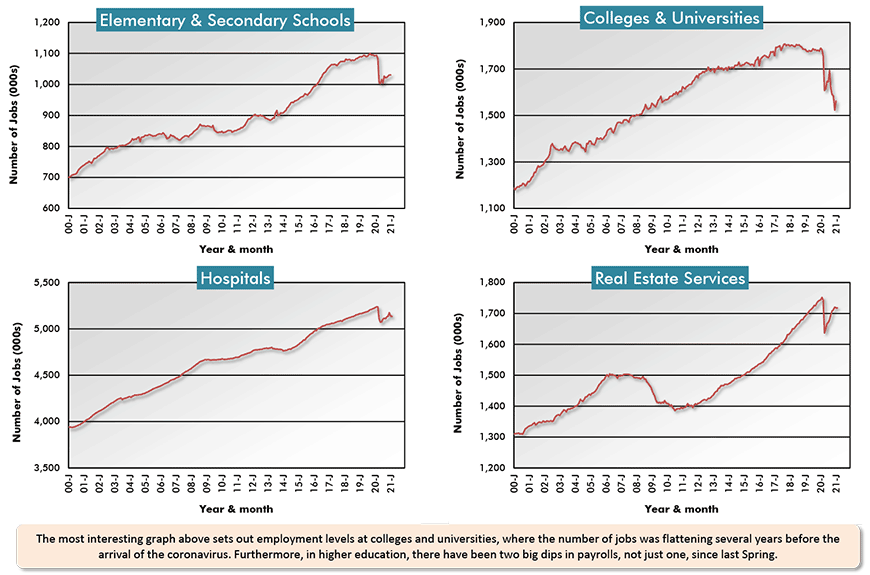
A Fierce Struggle for Employment in Academia
To my mind, the most interesting individual graph in Chart 6 is the one showing employment at ‘colleges and universities’. As with ‘elementary and secondary schools’, jobs with institutions of higher learning dropped in the Spring of last year, as students stayed home to combat the spread of the coronavirus contagion.
But at colleges and universities, the decline in employment wasn’t limited to a one-time event. There was a second shattering jobs setback in the Fall of last year that was as big in magnitude as the first. Wide-spread adoption of learning online combined with an absence of foreign students devastated payrolls.
A trend that should be pointed out, however, is that employment with colleges and universities was flattening during the three or four years prior to the arrival of the pandemic. But that may have been due to the booming economy. Ultra-low unemployment rates at the time encouraged young adults to jump into the workforce and forego the academic life.
Charts: ConstructConnect.
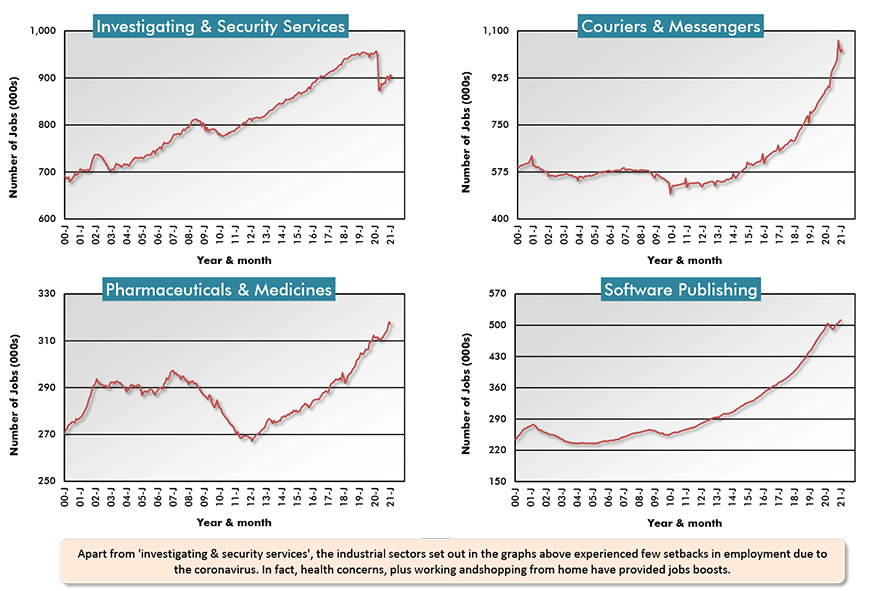
Where the Pandemic has acted as a Spur to Jobs
Finally, in Chart 7, we have four sectors under the handy, but admittedly now hackneyed designation ‘new wave’, where the record of employment has been remarkably upbeat. The number of jobs in these sectors just keeps growing.
In fact, the problems of the past year have largely acted as a spur to more work, as so much of business activity has shifted to cyberspace and the ‘clouds’. Jobs in software publishing have been skyrocketing.
And where work or entertainment can’t be digitized or streamed, physical deliveries of documents or consumer purchases are being undertaken by courier or messenger services, where jobs have also been plentiful.
Charts: ConstructConnect.
Please click on the following link to download the PDF version of this article:
Economy at a Glance Vol. 17, Issues 50 and 51 – Sweet and Sour Spots for Jobs in Suite of 28 Graphs – PDF
Alex Carrick is Chief Economist for ConstructConnect. He has delivered presentations throughout North America on the U.S., Canadian and world construction outlooks. Mr. Carrick has been with the company since 1985. Links to his numerous articles are featured on Twitter @ConstructConnx, which has 50,000 followers.


Recent Comments
comments for this post are closed