
Texas is in a League of its Own
Through the first half of 2021, the monthly average of seasonally adjusted and annualized (SAAR) housing starts in the U.S. has been +23.2% compared with January-June 2020. The one quarter increase in groundbreakings warrants the ‘mini-boom’ description being applied to the U.S. homebuilding market.

After climbing steadily through most of the second-half months of last year, the monthly figure has leveled off since December 2020. Furthermore, ‘permits’ which were leading ‘starts’ higher through much of 2020, have more recently descended from their peak in an apparent withdrawal to ‘base camp’ (see Graph 6).
How favorably are viewed the prospects for the Texas economy? Graph 2 provides a resoundingly upbeat answer. Among America’s 36 biggest cities (by population), the three leaders for level of residential building permits in H1 2021 were Dallas-Ft Worth (40,677 units), Houston (33,956 units) and Austin (28,459 units), all in Texas. (For cities, ‘permits’ are usually accepted by analysts as being equivalent to ‘starts’.)
The text box in Graph 2 mentions Jacksonville and Raleigh as two other cities with smaller populations than the 36 featured in the chart, but which have managed exceptional levels of residential groundbreakings (i.e., 11,925 units and +61.5% ytd for the former; 11,316 units and +42.3% ytd for the latter).
Some other urban areas that deserve spotlighting include Sarasota, Florida (8,017 units and +70.6% ytd); Provo-Orem, Utah (6,310 units; +74.8% ytd); Cape Coral-Ft Myers, Florida (6,086 units; +13.4% ytd); and Salt Lake City, Utah (5,872 units; +13.2% ytd).
On a ytd percent-change basis (Graph 3), Philadelphia (+115.5%) has been the frontrunner among major U.S. cities, followed by Detroit (+82.5%) and Denver (+74.8%). The fastest year-to-date increase among cities in Texas has been recorded by Austin (+49.4%, or ahead by half). Only two centers among the 36 have seen declines, and relatively small ones: Columbus, Ohio (-2.0%) and Miami-Fort Lauderdale (-5.5%).
The Lumber-in-Housing Story
The jump in U.S. housing starts soon exposed a severe shortage of construction-related forestry products, causing an almost overnight doubling in the price of softwood lumber and plywood. Presently, however, ‘futures’ contracts are indicating an easing in this supply-demand imbalance. The huge draw on wood from stay-at-home workers undertaking renovation projects is winding down. Also, there has been a ramping up of supply, partly satisfied by imports.
As an interesting aside, forestry product exports from British Columbia (which are mostly shipped to the U.S.) are +66.9% year to date, while from Quebec, they’re +28.9%.
The lumber price impact will linger regardless. A draw-dawn of the inventory of lumber purchased at extreme cost will take some time. Something else for readers to know is that the latest (June 2021) ‘inputs to new residential construction’ sub-index of the Producer Price Index (PPI) data set is +28.3% year over year. Prior to the pandemic, estimates of the cost of lumber as a proportion of total material costs of new residences were north of 25%. That figure must now be way out of date on the downside.
Graph 1: U.S. Total Monthly Housing Starts
Seasonally Adjusted at Annual Rates (SAAR)
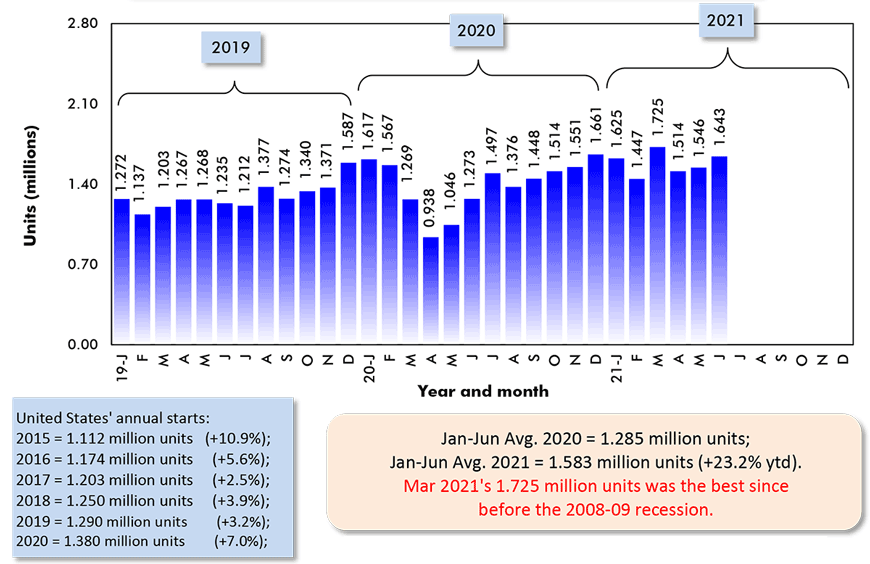
The last data points are for June 2021.
Data source: U.S. Census Bureau (Department of Commerce).
Chart: ConstructConnect.
Graph 2: Year to Date Residential Permits Issued (Units) in the 36 Most Populous U.S. Metro Statistical Areas (MSAs)
(Jan-Jun 2021)
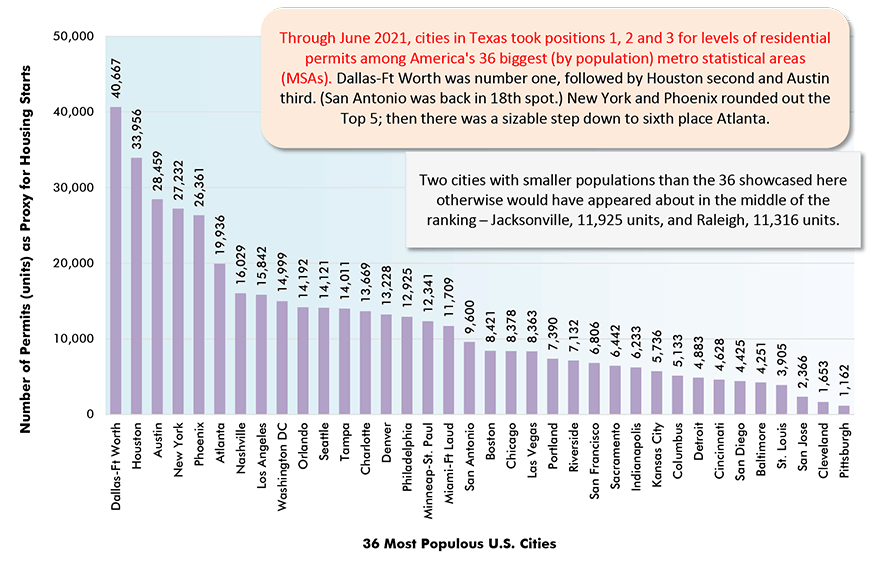
At the city level, the number of residential building permits issued serves as a proxy for housing starts.
Data source: U.S. Census Bureau.
Chart: ConstructConnect.
Graph 3: Percent Change in Year-to-Date Housing Permits Issued (Units) in the 36 Most Populous U.S. Metro Statistical Areas (MSAs)
(Jan-Jun 2021 vs Jan-Jun 2020)
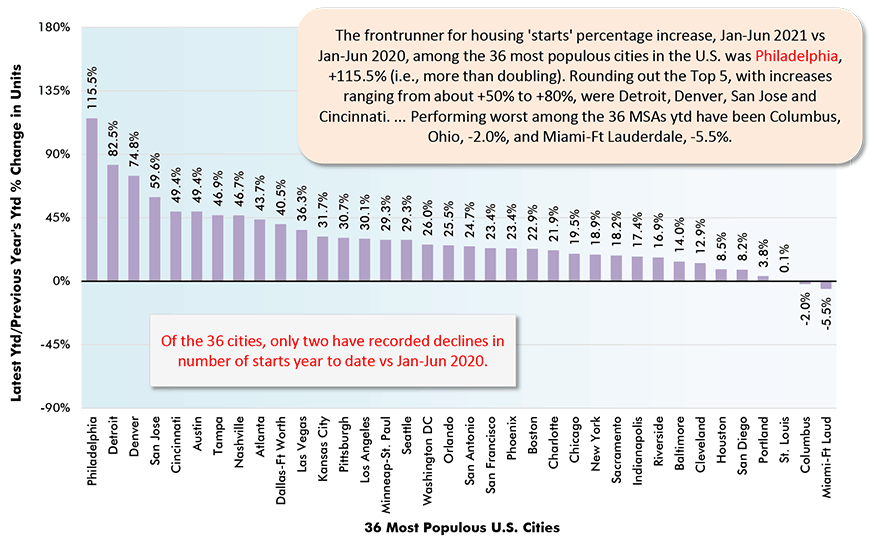
At the city level, the number of residential building permits issued serves as a proxy for housing starts.
Data source: U.S. Census Bureau.
Chart: ConstructConnect.
Graph 4: U.S. Single-Family & Multi-Family Monthly Housing Starts
Seasonally Adjusted at Annual Rates (SAAR)
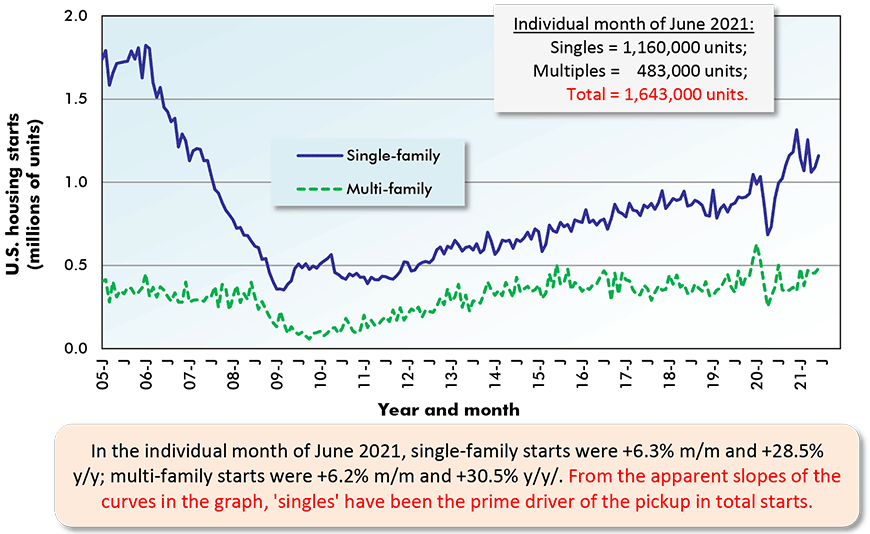
The last data points are for June 2021.
Data source: U.S. Census Bureau (Department of Commerce).
Chart: ConstructConnect.
Graph 5: U.S. Total Monthly Housing Starts
Seasonally Adjusted at Annual Rates (SAAR)
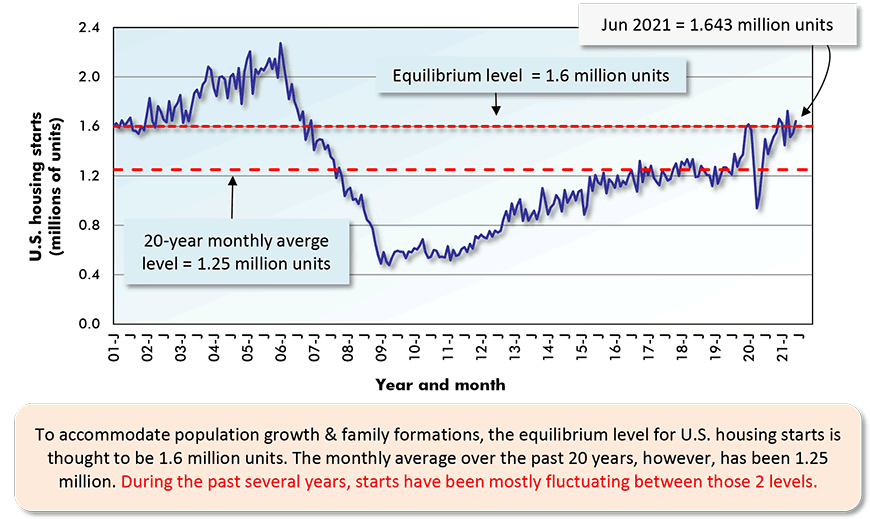
The last data point is for June 2021.
Data source: U.S. Census Bureau (Department of Commerce).
Chart: ConstructConnect.
Graph 6: U.S. Monthly Residential Building Permits
Seasonally Adjusted at Annual Rates (SAAR)
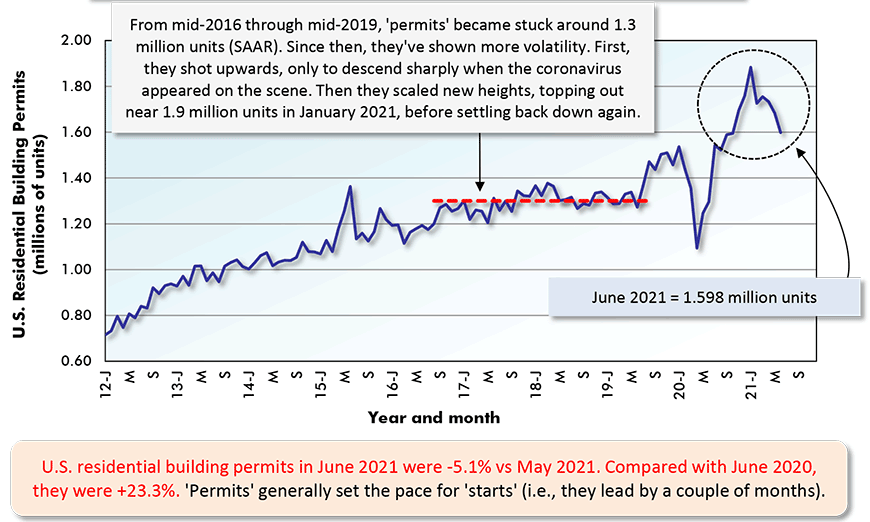
The last data point is for June 2021.
Data source: U.S. Census Bureau (Department of Commerce).
Chart: ConstructConnect.
Graph 7: U.S. Housing Starts
Jan-Jun 2021 vs Jan-Jun 2020 % Changes
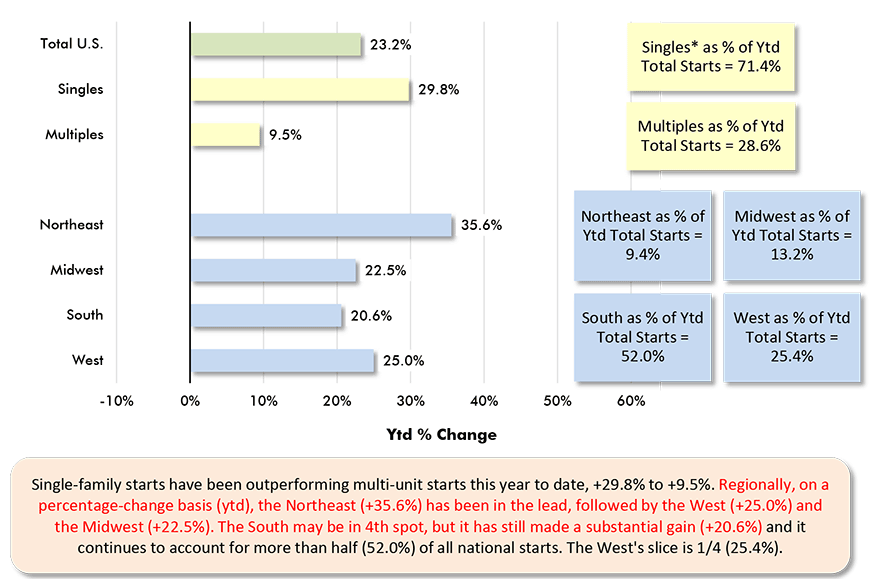
Based on averages of monthly seasonally adjusted and annualized (SAAR) unit starts.
* ‘Singles’ includes townhouse complexes, except when multiple units have common heating & air conditioning.
Data source: U.S. Census Bureau.
Chart: ConstructConnect.
Graph 8: U.S. Regional Housing Starts (SAAR) – June 2021
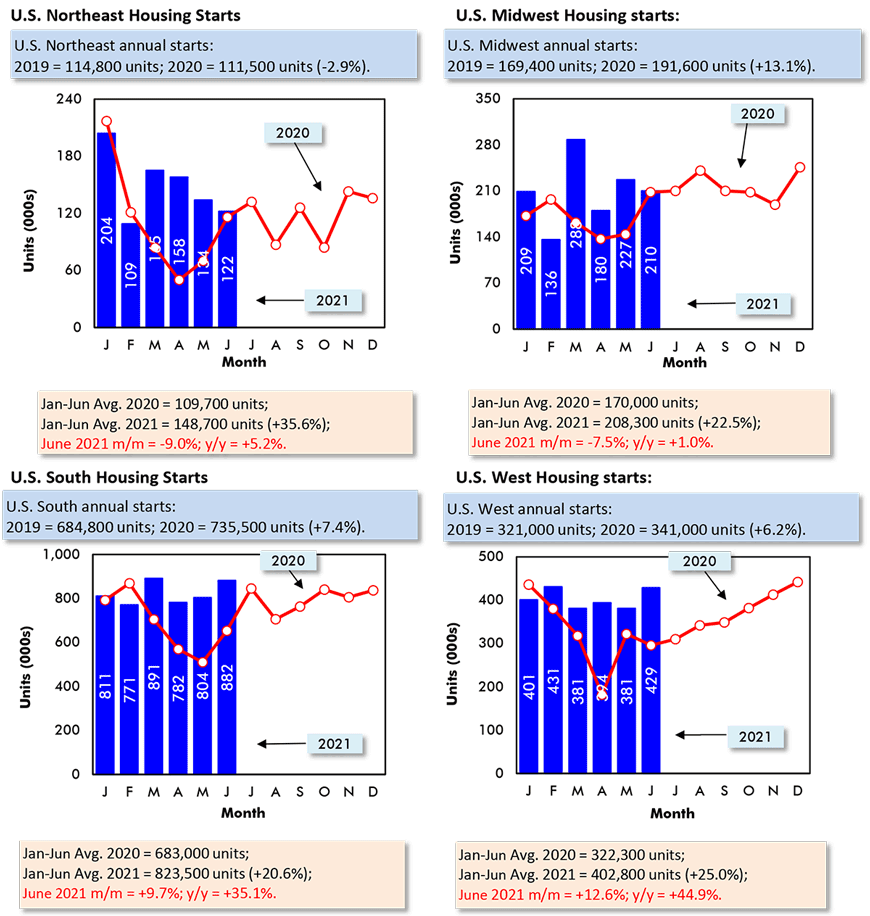
Data source: U.S. Census Bureau (Department of Commerce).
Chart: ConstructConnect.
‘Full-on Boom’ for Canadian Housing Starts
Through the first half of 2021, the monthly average of seasonally adjusted and annualized (SAAR) housing starts in Canada has been +47.7% compared with January-June 2020. The increase by half justifies the ‘full-on boom’ designation being applied to Canada’s homebuilding market.
Moreover, it’s being achieved with almost no contribution from Toronto. New home groundbreakings in the nation’s most populous metropolis are only +2%. Multi-unit starts in what had been the condo-building capital of North America for a decade or more are -3% year to date.
Demonstrating just how dominant Toronto is to the total Canadian homebuilding scene, the city still retains its leadership position among all urban areas in level of starts year to date, 18,213 units. But Montreal (17,321 units) and Vancouver (15,294) are nipping at its heels.
From Graph 12, the surges in year-to-date housing starts of +50% or more in Oshawa, London, Hamilton, Guelph, Kitchener, Windsor and Barrie confirm the pandemic-launched shift in accommodation demand away from Toronto’s high-density core.
The year-over-year increase in price of a new single-family home nation-wide is presently +11.9% according to Statistics Canada’s New Housing Price Index (NHPI) report. The ‘house alone’ price climb is +13.7%; ‘land alone’, +7.3%.
The Canadian cities with the biggest year-over-year new house price increases are Kitchener-Cambridge-Waterloo, +27.7%; Ottawa-Gatineau (on the Ontario side of the river), +26.2%; Windsor, +22.8%; Montreal, +19.9%; and Winnipeg, +18.1%.
Graph 9: Canada Monthly Housing Starts
Seasonally Adjusted at Annual Rates (SAAR)
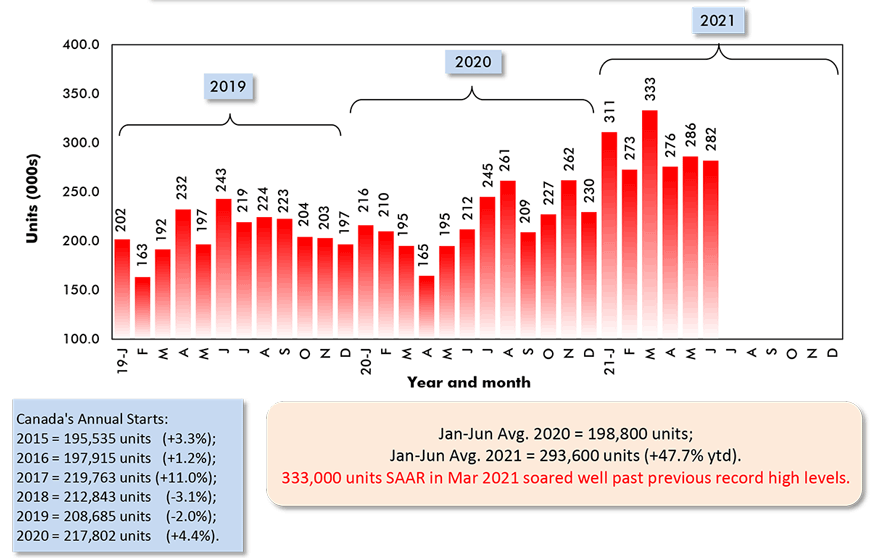
Data source: Canada Mortgage and Housing Corporation (CMHC).
Chart: ConstructConnect.
Graph 10: U.S. and Canada Monthly Housing Starts
Seasonally Adjusted at Annual Rates (SAAR)
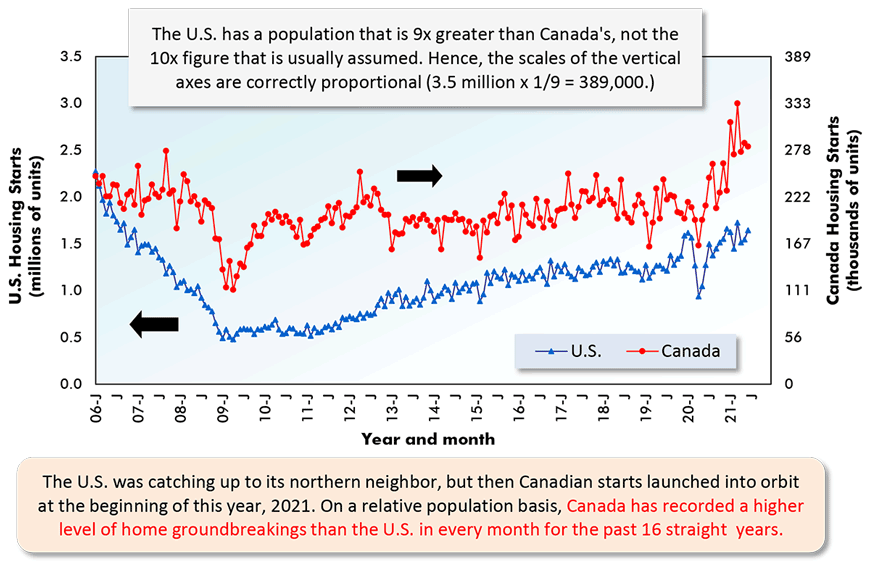
The last data points are for June 2021.
ARROWS: U.S. numbers to be read from left axis; Canadian from right axis.
Data sources: U.S. Census Bureau & Canada Mortgage and Housing Corp (CMHC).
Chart: ConstructConnect.
Graph 11: Percent Change in Year-To-Date Housing Starts –
Ranking Of Canada’s Provinces
(Jan-Jun 2021 vs Jan-Jun 2020)
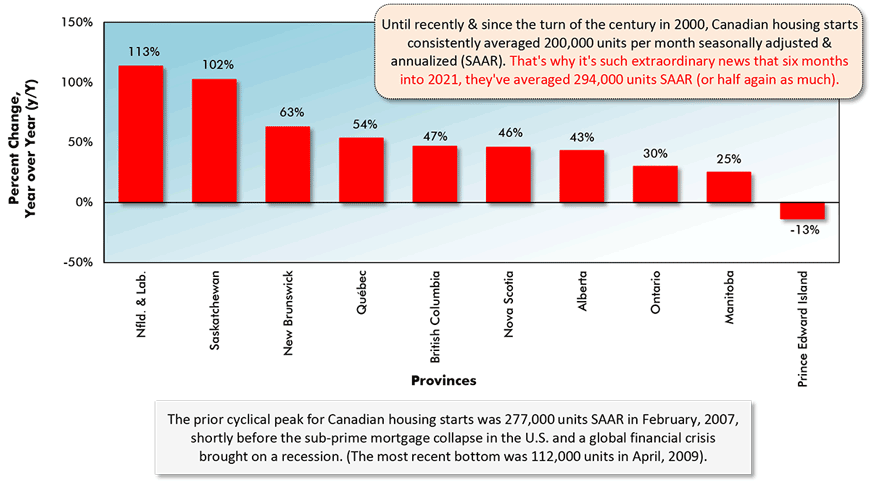
Data source: Canada Mortgage & Housing Corporation (CMHC) based on actuals rather than seasonally adjusted data.
Chart: ConstructConnect.
Graph 12: Percent Change in Year-To-Date Housing Starts –
Ranking Of Canada’s Major Cities
(Jan-Jun 2021 vs Jan-Jun 2020)
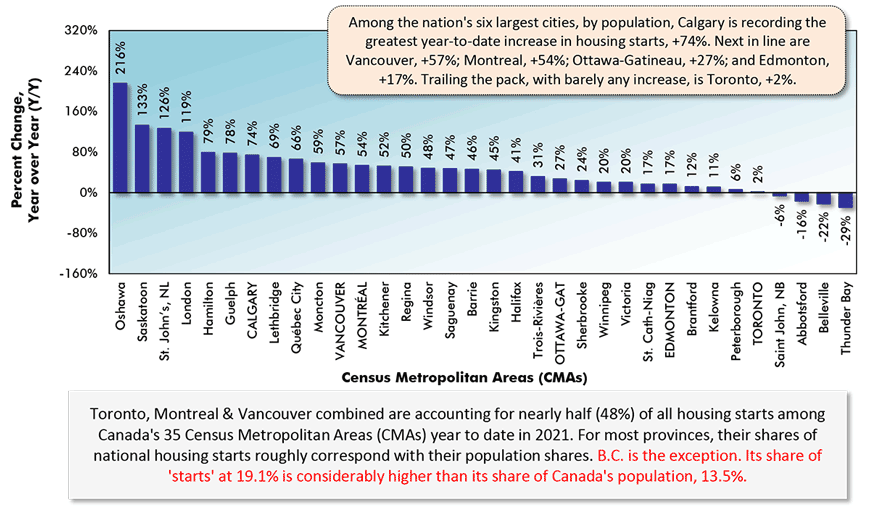
Canada’s Census Metropolitan Areas (CMAs) have core populations of 50,000 plus.
Canada’s 6 CMAs with populations in excess of 1 million are in capital letters.
Data source: Canada Mortgage & Housing Corporation (CMHC) based on actuals rather than seasonally adjusted data.
Chart: ConstructConnect.
Graph 13: Housing Starts in Canada’s 6 Most Populous Cities
January to June 2021 Actuals
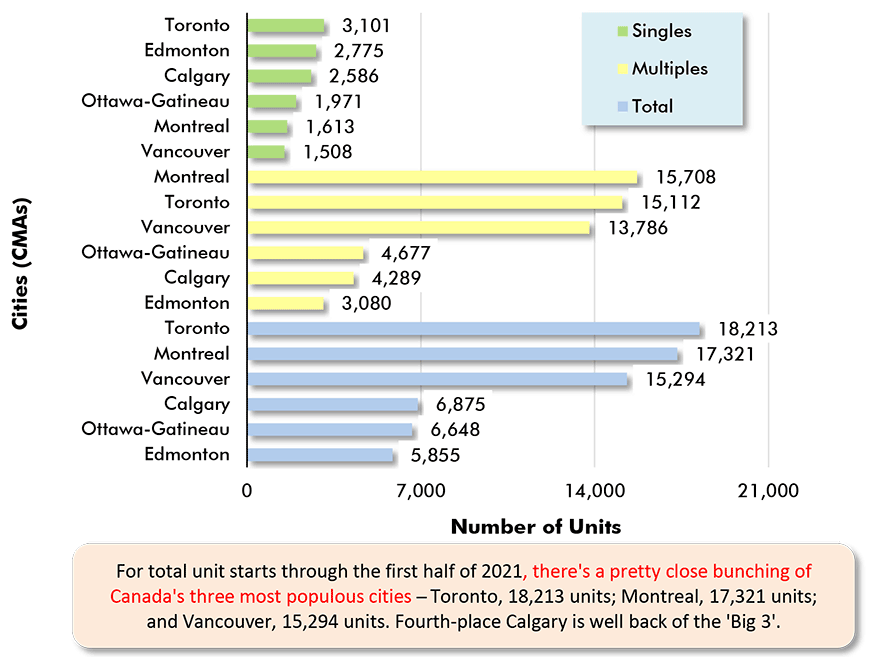
Data source: Canada Mortgage & Housing Corporation (CMHC).
Chart: ConstructConnect.
Graph 14: Housing Starts in Canada’s 6 Most Populous Cities
Jan-Jun 2021 vs Jan-Jun 2020
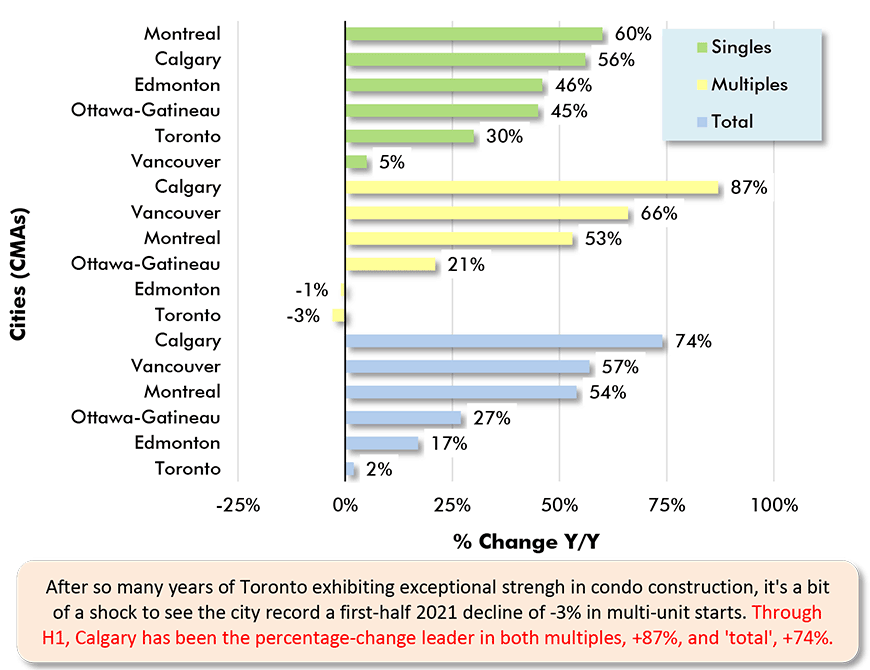
Data source: Canada Mortgage & Housing Corporation (CMHC).
Chart: ConstructConnect.
Please click on the following link to download the PDF version of this article:
Economy at a Glance Vol. 17, Issues 112, 113 and 114 – Economic Heavy Lifting by U.S. & Canadian Homebuilders – PDF
Alex Carrick is Chief Economist for ConstructConnect. He has delivered presentations throughout North America on the U.S., Canadian and world construction outlooks. Mr. Carrick has been with the company since 1985. Links to his numerous articles are featured on Twitter @ConstructConnx, which has 50,000 followers.


Recent Comments
comments for this post are closed