
Due to its complexity, much of the subject matter concerning the economy requires detailed editorial commentary, often supported by relevant tables and graphs.
At the same time, though, there are many topics (e.g., relating to demographics, housing starts, etc.) that cry out for compelling ‘shorthand’ visualizations.
Whichever path is followed, the point of the journey, almost always, is to reach a bottom line or two.
To provide additional value, ConstructConnect is now pleased to offer an ongoing series of 1,000-word charts.
These will help readers sort out the ‘big picture’ more clearly.
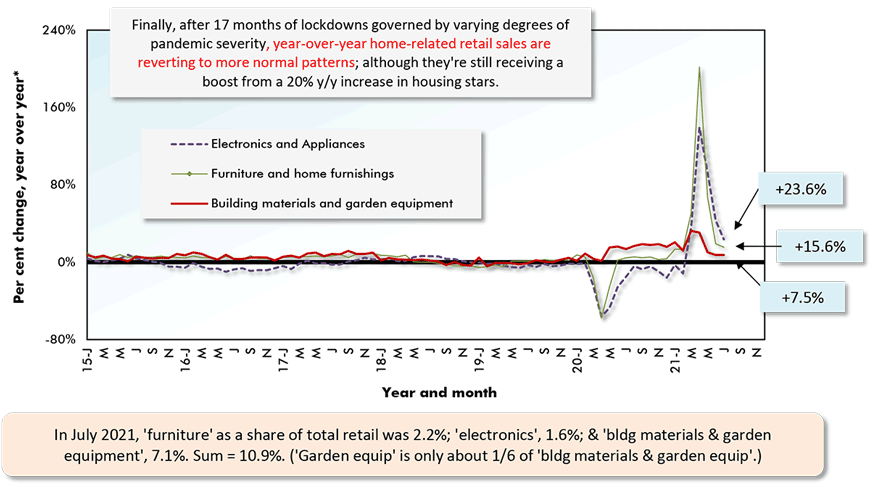
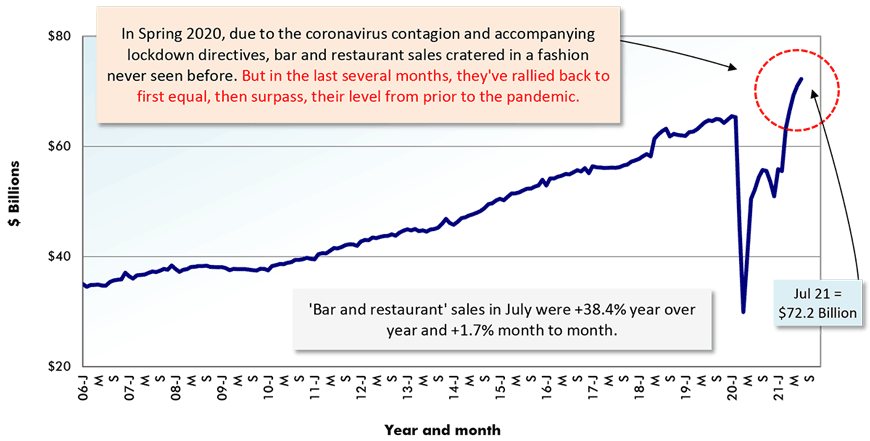
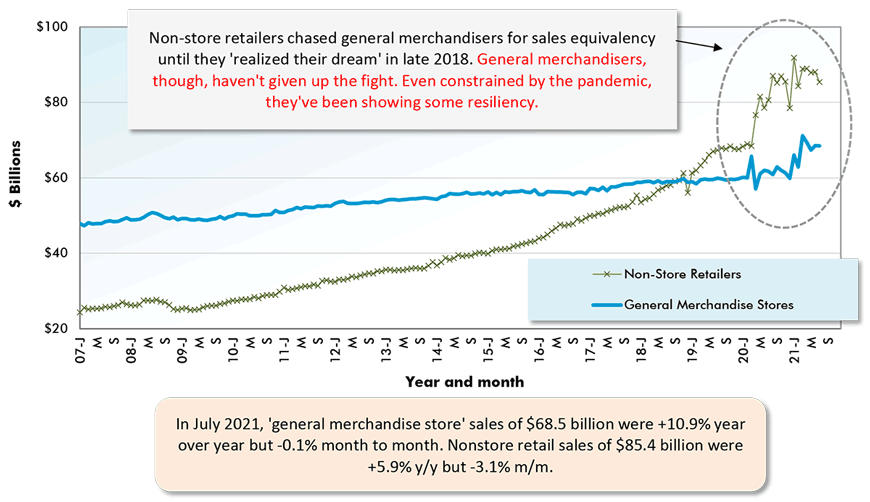
These 1,000-word charts look at the latest retail sales figures in the U.S. (as of June and July 2021).
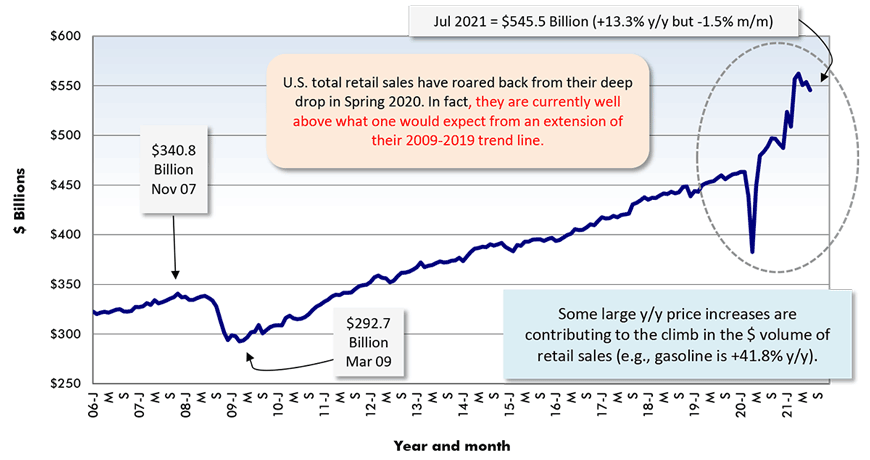
Adjusted for seasonality and trading day differences, but not for price changes (i.e., figures are in ‘current’ dollars).
Chart: ConstructConnect.
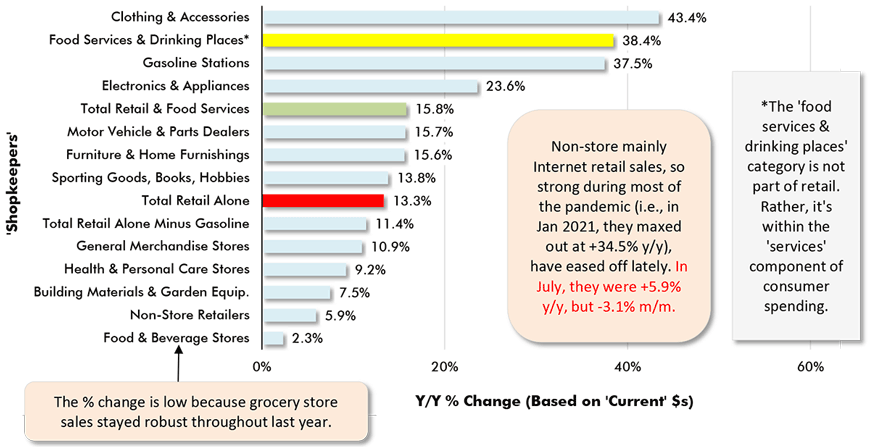
Chart: ConstructConnect.
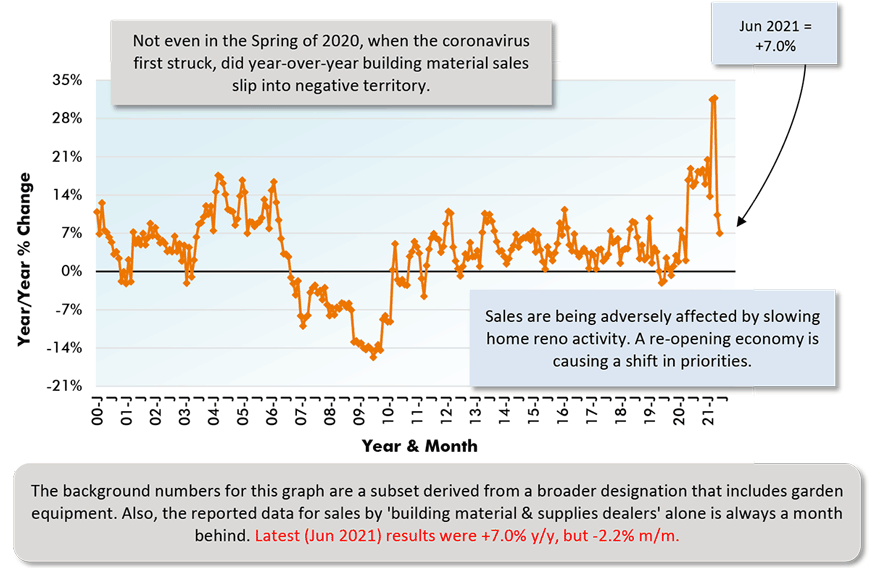
Chart: ConstructConnect.
Based on ‘current’ (i.e., not adjusted for inflation) dollars. Latest data points are for July, 2021.
Adjustments are for seasonal variation, holiday and trading day differences, but not for price changes.
Chart: ConstructConnect.
Adjusted for seasonal variation, holiday and trading day differences, but not for price changes.
Chart: ConstructConnect.
(i.e., Internet Platforms & E-Auction Houses)
Adjusted for seasonal variation, holiday and trading day differences, but not for price changes.
Chart: ConstructConnect.
Please click on the following link to view the latest retail sales charts for the U.S. and Canada: CanaData Forecaster Charts & Tables – Retail Sales
Alex Carrick is Chief Economist for ConstructConnect. He has delivered presentations throughout North America on the U.S., Canadian and world construction outlooks. Mr. Carrick has been with the company since 1985. Links to his numerous articles are featured on Twitter @ConstructConnx, which has 50,000 followers.


Recent Comments
comments for this post are closed