
August’s Employment Situation report from the Bureau of Labor Statistics (BLS) says that the total number of jobs in the U.S. economy rose by +235,000 in the latest month. A gain of nearly a quarter of a million jobs may sound like a lot, but in the grand scheme of things, it’s rather tame.

Compare it with the month prior’s performance. July was originally reported at +943,000 jobs. That figure has now been revised higher to +1.053 million.
Job creation in August became bogged down. It was probably due to the coronavirus making a comeback, by way of the Delta variant, and threatening a fourth wave heading into the Fall.
The best illustration of how hiring tapped out in August can be found in the ‘leisure and hospitality’ sector. The economy-wide staffing change with bars and restaurants and hotels/motels in the latest month was zero.
Nevertheless, it’s encouraging to note that the year over year change in ‘leisure and hospitality’ employment is a strong +17.4%.
Total employment is now +4.3% y/y; construction employment is +2.7%.
Once again, the construction sector in August was not a source of net new jobs. Rather, it cut 3,000 positions, mainly in the engineering/civil field (-8,000). Residential sub-trade contractors, however, did increase their payrolls by +17,000 (see Graph 1).
The seasonally adjusted (SA) national headline unemployment rate in August was 5.2%, down from 5.4% in July and considerably improved from August 2020’s 8.4%. The not seasonally adjusted (NSA) U rate in the latest month was 5.3% compared with 5.7% in July and 8.5% in year-ago August.
The participation rate (i.e., the proportion of adults wanting to work) has stayed steady at 61.7% for a while now.
Construction’s NSA unemployment rate in August was 4.6%. In August 2020, it had been 7.6%.
The manufacturing sector’s NSA U rate is now 3.6% versus 6.7% a year ago. As one bit of good news, manufacturers have increased their total employment level by +157,000 jobs over the past four months.
The NSA U rate in durables manufacturing is now only 3.3%, or in other words, quite tight.
The NSA U rate in ‘leisure and hospitality’ remains elevated at 9.1%, but consider that a year ago, it was 21.3%.
Compensation Rates Keep Climbing
As for wage increases, they keep speeding up. From Table B-3 (which includes supervisors) of the Employment Situation report, ‘all jobs’ earnings in August were +4.3% year over year both hourly and weekly. For construction workers as a subset of ‘all jobs’, the y/y compensation climbs were +3.9% hourly and +3.7% weekly.
From Table B-8 (which excludes bosses), economy-wide earnings were +4.8% hourly and +5.4% weekly. The construction sector increases were a little less exuberant at +4.5% hourly and +4.7% weekly.
The bottom line with respect to compensation rates, though, is that they are creeping upwards towards +5.0% y/y.
Another smidge of good news concerns the number of individuals on the long-term unemployed roster. In August, there was a drop of a quarter of a million (-246,000) in the number of people out of work for 27 weeks or more.
August’s bland jobs-creation result was telegraphed by the weekly ‘initial jobless claims’ report (Graph 2) where the figure still resides above 300,000. The U.S. labor market only truly becomes ‘hot’ when weekly initial jobless claims recede close to 200,000.
None of this is bothering the stock markets (see Table 1). In August, the DJI, S&P 500 and NASDAQ all took another step up the ladder, establishing new record highs along the way.
Graph 1: Change in Level of U.S. Construction Employment, Month to Month (M/M) −
Total & by Categories – August 2021
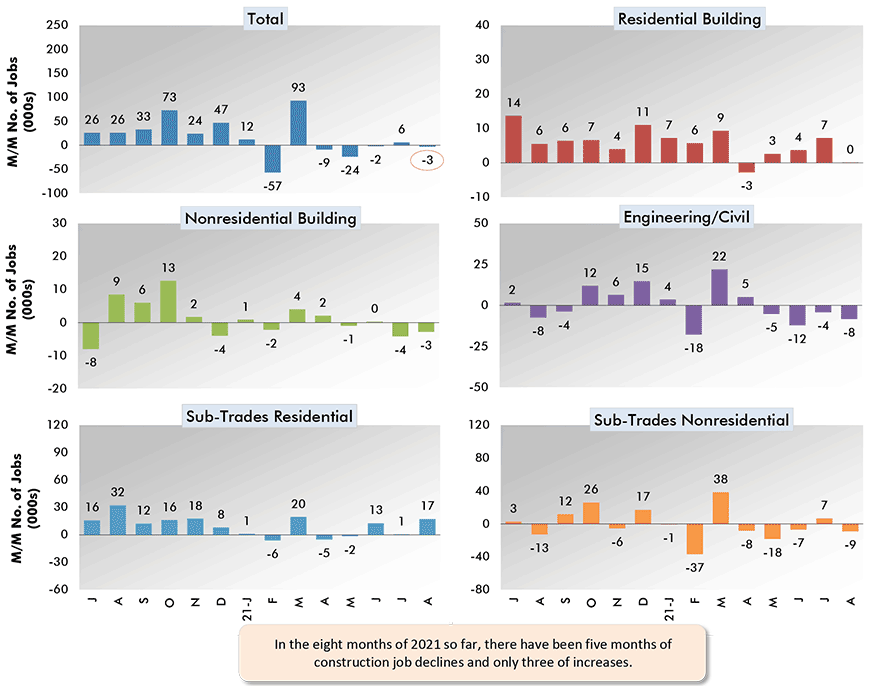
Chart: ConstructConnect.
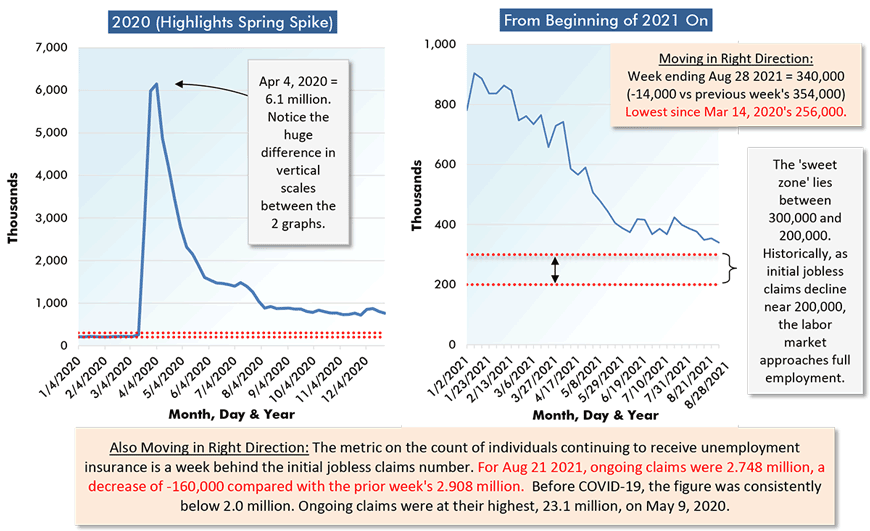
Chart: ConstructConnect.
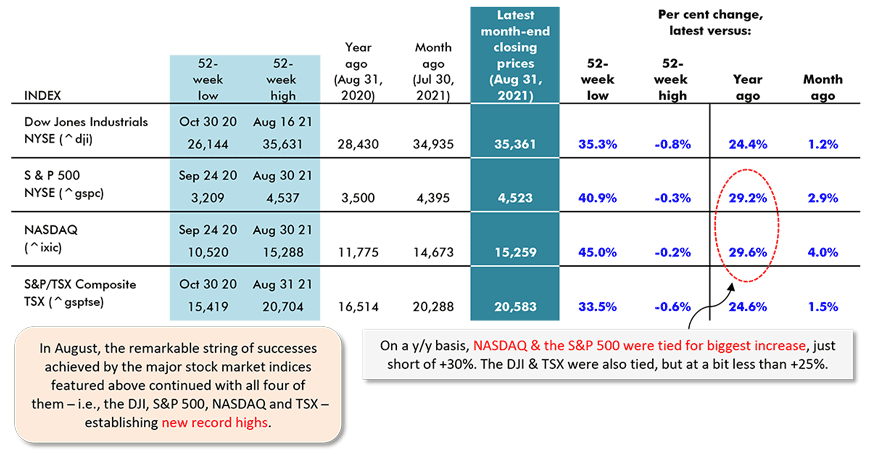
Securities Dealers Automated Quotations (NASDAQ), Toronto Stock Exchange (TSE) and Reuters.
Table: ConstructConnect.
Alex Carrick is Chief Economist for ConstructConnect. He has delivered presentations throughout North America on the U.S., Canadian and world construction outlooks. Mr. Carrick has been with the company since 1985. Links to his numerous articles are featured on Twitter @ConstructConnx, which has 50,000 followers.
Please click on the following link to download the PDF version of this article:
Economy at a Glance Vol. 17, Issue 133 – Little Meat on the Bones of the August U.S. Jobs Report – PDF


Recent Comments
comments for this post are closed