
An Excess of U.S. Retail Demand
Consumer spending is about 70% of gross domestic product (GDP) in the U.S. and 55% in Canada. (The lower percentage in Canada is due to foreign trade being relatively more prominent in overall economic activity north of the border.)

Retail sales, which are widely reported by the media, are an important part of consumer spending (between 40% and 45%), although they are exceeded by spending on services, which are more varied and not quite as easy to package in a summary.
Hence, considerable attention is given to the health of retail sales, with the tie-in to GDP growth usually cited.
After the plunge in U.S. retail sales in the Spring of last year, they recovered quickly. Then they went the proverbial ‘extra mile’. Graph 1 shows that the current level of retail sales isn’t just what might be expected if the pattern from 2009 through 2019 were extended outwards. It’s considerably more.
Yes, there’s been a make-up of the ground lost during the big dip last year, but there’s also been notable additional strength. Several factors have played contributing roles.
Because people haven’t been traveling (i.e., a consumer spending ‘service’ when undertaken domestically), or going to concerts, or dining out, or even commuting as much, they’ve had extra cash to spend in other areas. The ‘savings rate’, a line item in the National Income accounts, shot up to 30% in the early summer of 2020 and has still not fully retreated to its long-term figure of about 8%. It currently sits at 10%.
Staying at home far more than usual initially led to a burst in sales of do-it-yourself renovation products and electronics for work and amusement. More recently, there have been sharp climbs in the purchases of appliances and furniture.
Prior to the pandemic, purveyors of general merchandise were content to see their revenue increase in a slow but steady manor. In 2019, however, the competition employing Internet platforms caught up with and rapidly blew past them (Graph 3). It seems to have been a wake-up call, with the arrival of the coronavirus and accompanying lockdowns providing another spur to action. Beginning in 2020, general merchandisers have managed sales gains beyond what they were content with previously, largely thanks to their own adoption of online marketing.
A Mystery Parcel or Two at the Door
Across a wide spectrum of goods (e.g., clothing; groceries) and services (e.g., entertainment), Internet selling has jumped in to facilitate the hook-up between buyers and sellers. It should be added, in not so tongue in cheek fashion, that there are managers of household finances (e.g., me) who would argue online purchasing has become too easy (e.g., for the rest of my family). Seemingly every day, a mystery parcel or two shows up at our front door, to be claimed by someone in our home other than myself.
There’s concern being expressed that Black Friday this year and even the Xmas holidays may be fallow times for purchases and gift giving due to the interruption of supply chains from Asia. There’s an unprecedented backup of ships waiting to be offloaded at ports along the Pacific Coast. Plus, the number of truck drivers to transport cargo to sales outlets and distribution facilities is proving to be grossly inadequate.
Public discussion of the problem of shortages is mainly being linked to the issue of inadequate labor resources despite employment not yet matching its level from before the health crisis. Clearly, though, there’s another major component in the mix that’s accounting for glitches in deliveries, a trying-to-shake-off-the-pandemic excess of demand.
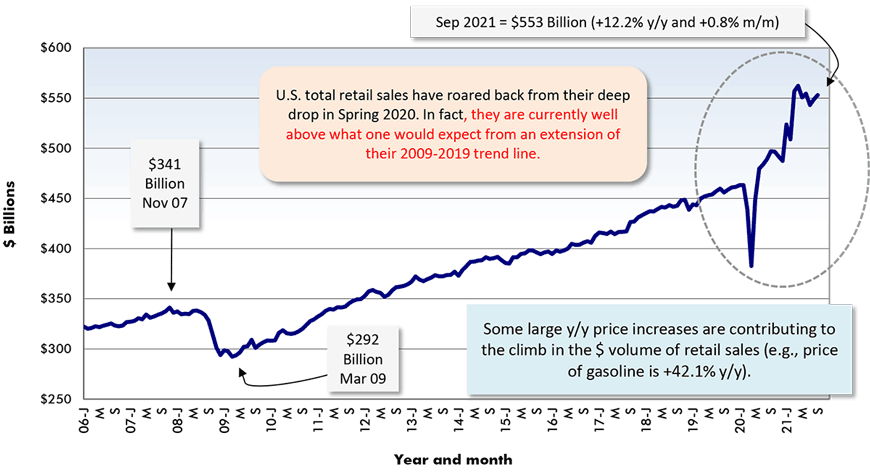
Adjusted for seasonality and trading day differences, but not for price changes (i.e., figures are in ‘current’ dollars).
Chart: ConstructConnect.
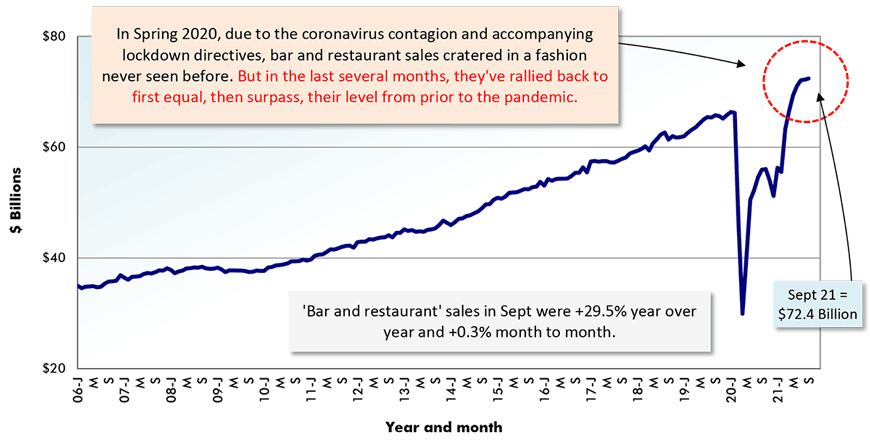
Adjusted for seasonal variation, holiday and trading day differences, but not for price changes.
Chart: ConstructConnect.
(i.e., Internet Platforms & E-Auction Houses)
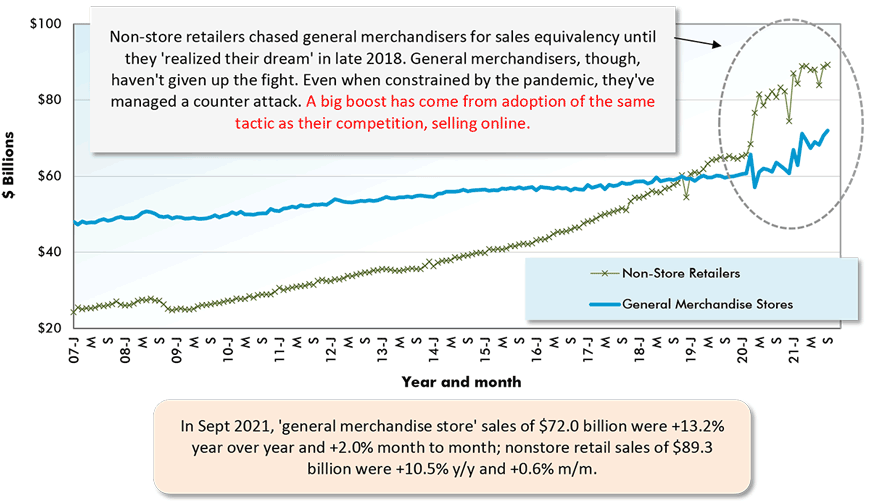
Adjusted for seasonal variation, holiday and trading day differences, but not for price changes.
Chart: ConstructConnect.
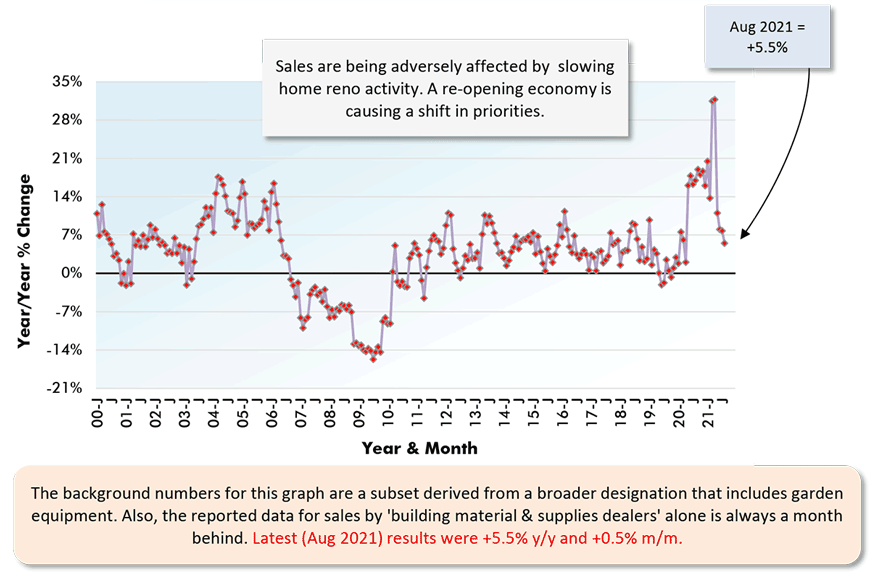
Chart: ConstructConnect.
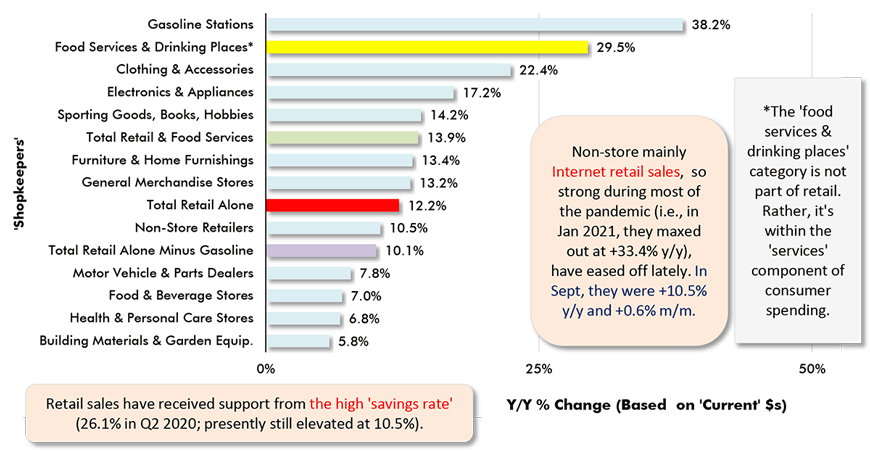
Chart: ConstructConnect.
An Encouraging but Cooler Retail Scene in Canada
As in the U.S., retailers in Canada have put the horrors of the Spring of last year behind them and are now enjoying more prosperous sales levels once again. But unlike the U.S., the total dollar revenue has not bounced exceedingly high, but is rather just about in line with an extension of the trend line that might be overlayed along the actual figures from 2009 to 2019 (Graph 6).
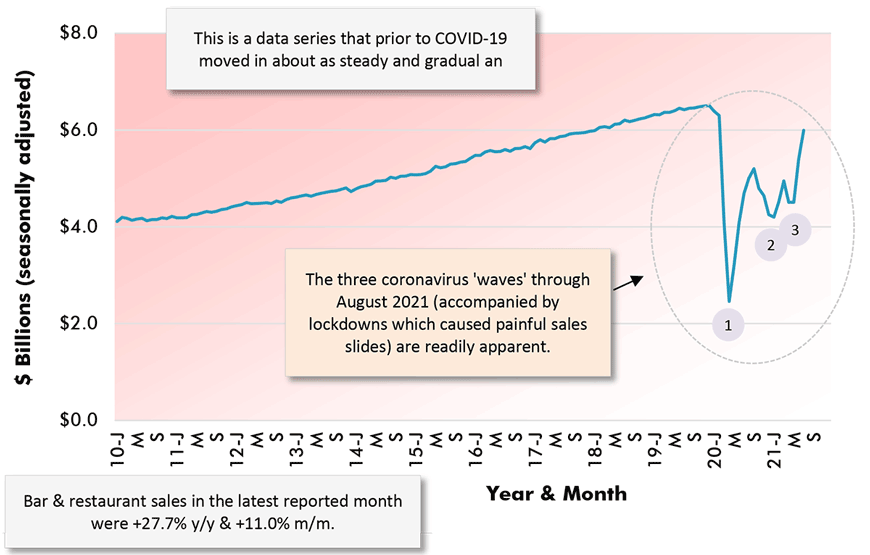
Let’s step away from retail sales for a moment and consider how food services and drinking places have been doing. Graph 2 shows the remarkable turnaround pulled off by bar and restaurant owners in the U.S. Receipts haven’t just recovered, they’re at new all-time peaks.
Graph 9 for Canada doesn’t tell as happy a story. Sales have improved dramatically from their atrocious trough, but there’s still some distance to be made up before they arrive back on their long-term track. Provinces have generally been more aggressive than States in asking businesses to shutter their operations during successive waves of the COVID virus and its variants.
There’s a story from the hospitality sector that relates to the uptick in inflation that is currently underway. Many restauranteurs and food fast chains have survived by adopting and embracing a societal change that has been underway regardless, the ordering in of meals. Such a practice, which has been speeded up by ‘social distancing’, may be fun and it may be convenient, but it’s not the cheapest way to eat. No one’s likely to argue that it’s as easy on the wallet or purse as conjuring up mac and cheese or a baloney sandwich.
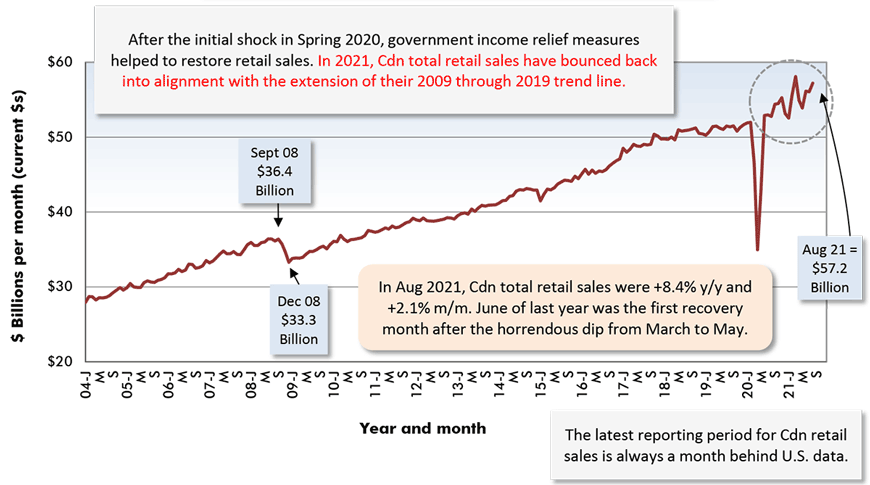
Chart: ConstructConnect.
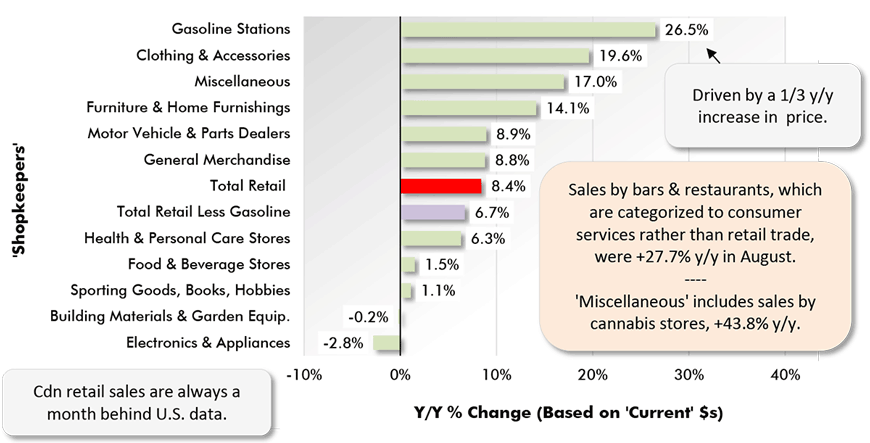
Chart: ConstructConnect.
August 2021 Year-over-Year (Y/Y) & Shares
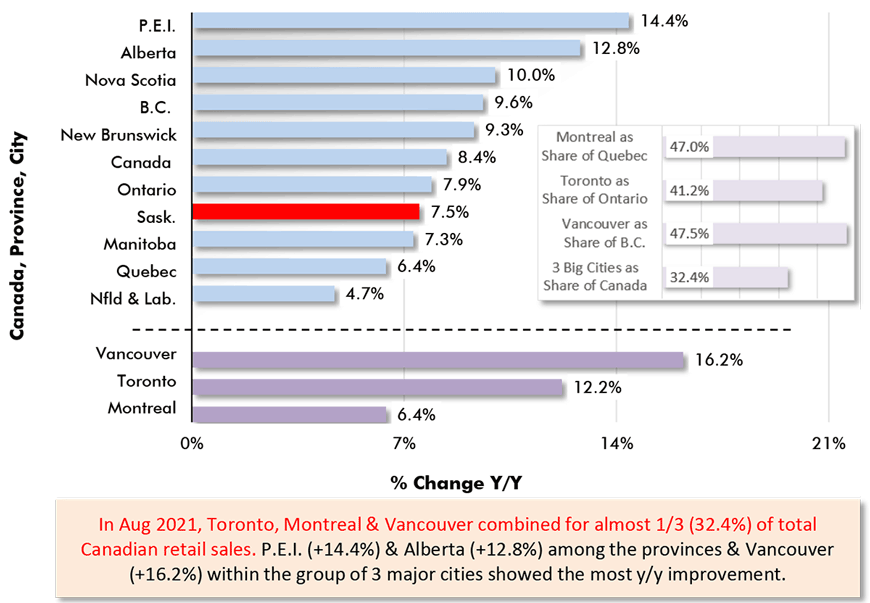
Chart: ConstructConnect.
Latest data point is for August 2021.
Chart: ConstructConnect.
Based on Data Adjusted for Seasonal, Holiday & Trading Day Differences
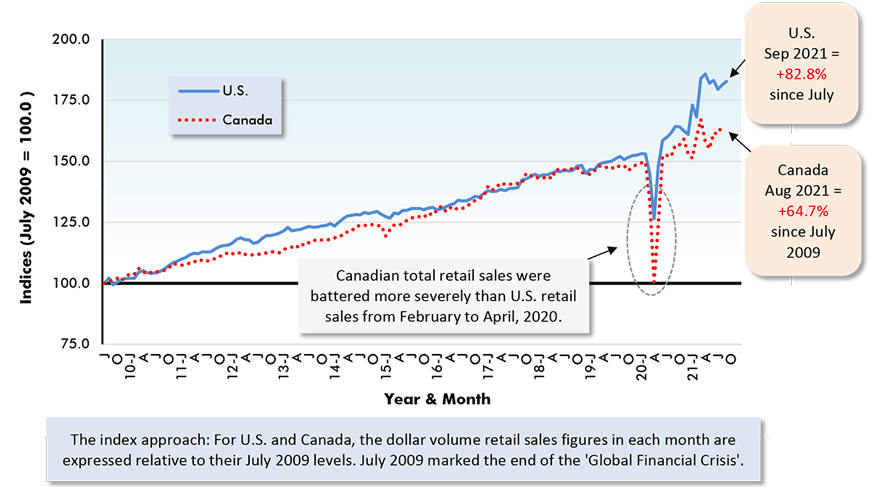
Chart: ConstructConnect.
Alex Carrick is Chief Economist for ConstructConnect. He has delivered presentations throughout North America on the U.S., Canadian and world construction outlooks. Mr. Carrick has been with the company since 1985. Links to his numerous articles are featured on Twitter @ConstructConnx, which has 50,000 followers.


Recent Comments
comments for this post are closed