
Among ConstructConnect’s Top 10 project starts list for October are two that seem perfectly in sync with the times in which we’re living. For much of the past year-and-a-half, many of us have been cooped up at home as a precaution against contracting the coronavirus. Some of us have gone on fitness regimes; and we’ve all been aware, whether embracing it or not, of the extraordinarily swift breakthroughs made in vaccination protection.

As a direct result, pharmaceutical company Pfizer has just broken ground on a nearly half-billion-dollar modular aseptic processing facility in Michigan. And fitness equipment company Peloton has begun foundation work for a $400 million plant in Luckey, Ohio, situated south of Toledo.
The biggest project start in the latest month carries an estimated dollar value of $1.2 billion and it’s the new arena for the NBA Los Angeles Clippers. In the several years prior to the pandemic, multiple stadium and arena projects were initiated in major cities in the U.S. and Canada.
Presently, talk about additional new projects is beginning to heat up again. In football, the Buffalo Bills are planning a new stadium; in hockey, the Calgary Flames will have a new home in an about-to-be-built event center; in baseball, there’s speculation the Devil Rays may split their home games between new ballparks in both Tampa and Montreal. In pro soccer, the governing body wants to expand the number of its franchises into the mid-30s range like the other three big-time leagues.
It’s not just in the field of sports where, after a chilling hiatus, plenty of buzz is emerging about upcoming major projects and this is good news for construction GC and sub-trade players.
There are also the following nuggets to be gleaned from the latest data releases posted by outspoken public and private sector agencies. Let’s begin with the topic that, after the covid case count, is top-of mind, rampaging price increases. (By the way, for the record, the present U.S. virus case count on a per capita basis is about three times higher than Canada’s.)
(1) The U.S. inflation rate has climbed to +6.2%, or at least that’s the October year-over-year change in the All-items Consumer Price Index for Urban Consumers (CPI-U). The media has jumped all over the fact the gain is the greatest in three decades. The cries of alarm may have gone a little overboard. In July 2008, there was a y/y advance in CPI-U of +5.6%, not far off the latest figure. Nevertheless, +6.2% is eye-popping and there’s no guarantee that a ceiling has been reached. The logistical bottlenecks on the West Coast leading to the shortages problem are now being augmented by devastating rain damage that has severed crucial road and rail cargo routes.
(2) The biggest advances in U.S. prices have come in four product areas: (a) energy; (b) motor vehicles; (c) meat; and (d) items for the home. Some examples are provided in Graph 1’s sidebar text box. The price of petrol is up by a half y/y, +49.6%. Used cars and trucks carry a collective sticker price that’s ahead by a quarter, +26.4%. Bacon, beef, and veal cost a fifth more, +20.2%. And laundry equipment and furniture will set buyers back by between +12% and +15% y/y.
(3) U.S. wage rates across all sectors have been moving into a range of +5% to +6% hourly and weekly. That’s a doubling from their traditional increase that has fluctuated around +2.5% y/y. In the inflation story, there’s a key sense in which wages play a unique role. When they increase significantly, a valid question is whether one should weep or cheer. Yes, as an input that partners with materials, they drive costs higher. But they also make it easier for workers to buy pricier things. Remember that consumer purchases power 70% of U.S. gross domestic product (GDP).
(4) Canada’s ‘official’ or headline inflation rate, at +4.7% y/y for the CPI in October, hasn’t yet become quite as unruly as its U.S. counterpart. The biggest price advances, though, have been for the same surveyed items as in America: passenger vehicle rental (+60% y/y); natural gas service (+19%); beef and ham (+14% to +18%); and home appliances and furniture (+12%). The major difference north of the border is that the Governor of the Bank of Canada, Tiff Macklem, unlike the Chairman of the Federal Reserve, Jerome Powell, when addressing the timing of an interest rate hike, has said action may be taken sooner than first anticipated, maybe in Q2 of next year.
(5) A corner of the economy that was really put through the wringer early on when the coronavirus first touched down was the airline industry. The negative ripple effects on car rentals, hotel and motel reservations, convention and trade show bookings, and purchases of tour packages was severe. Finally, a turnaround is underway. A year ago, the airport checkpoint numbers compiled by the Transportation Security Administration (TSA) for the fifteen days in the first half of November were only 35% of what they had been during the same time frame in 2019. This year, the November 1 to 15 traveler throughput number is 81% of 2019’s level, a greatly improved showing. North of the border, according to the air passenger count made by Statistics Canada for August of this year, there’s been a degree of recovery, but it’s still less than 50% of what’s needed for a return to ‘normal’.
(Not Seasonally Adjusted)
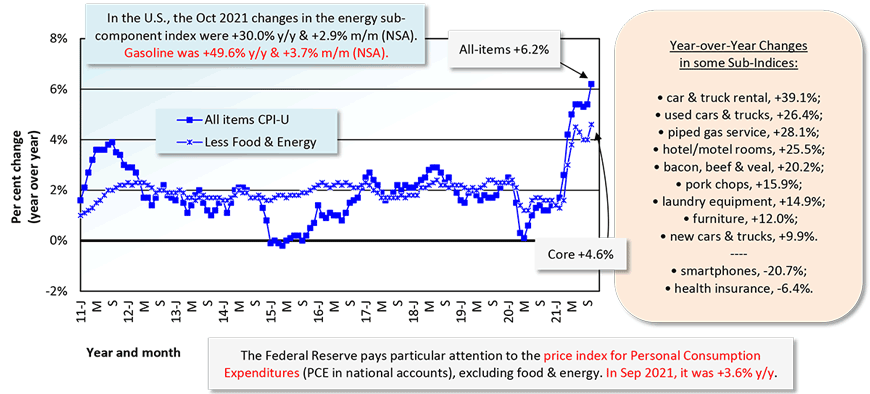
The U.S. figure (CPI-U) is the All Items Consumer Price Index for All Urban Consumers.
*Core inflation is CPI-U less its often most volatile sub-components, food and energy.
Chart: ConstructConnect.
(Not Seasonally Adjusted)
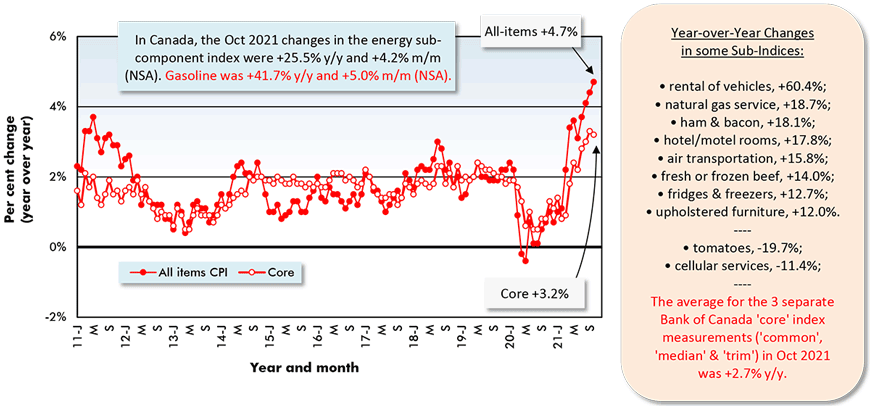
The Canada figure (CPI) is the All Items Consumer Price Index.
*Core inflation is CPI-U less its often most volatile sub-components, food and energy.
Chart: ConstructConnect.
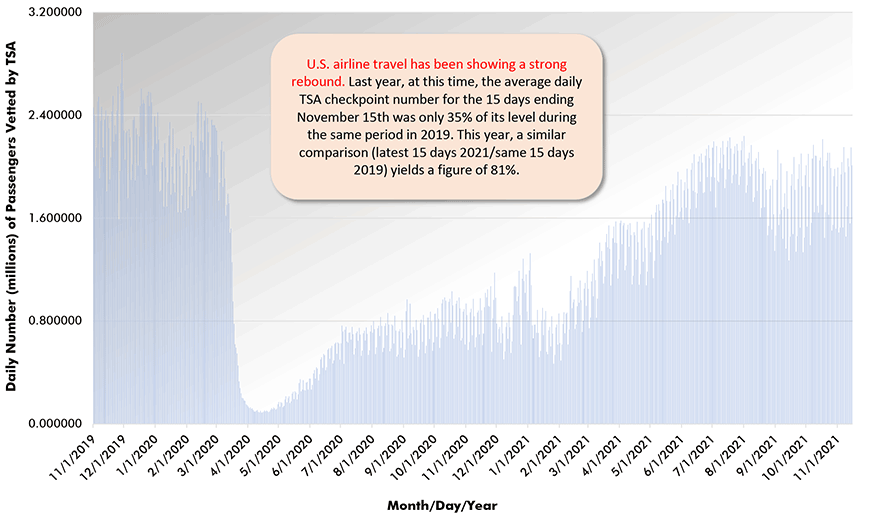
Chart: ConstructConnect.
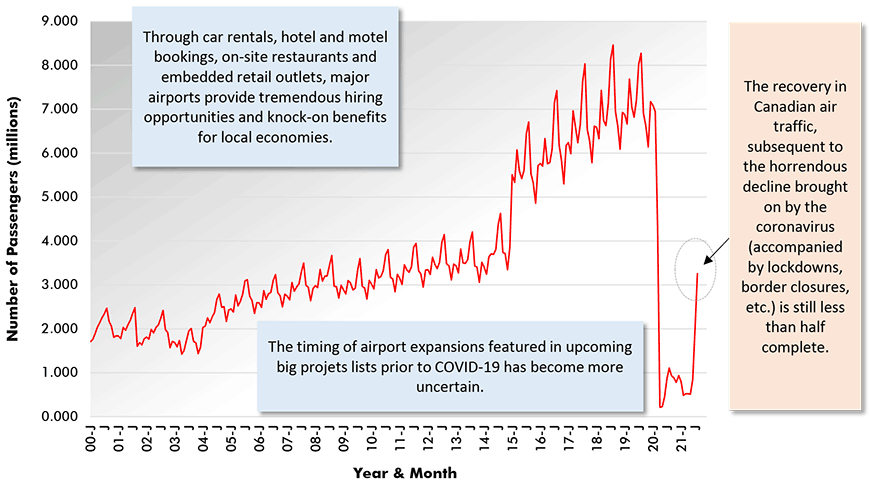
Chart: ConstructConnect.
Alex Carrick is Chief Economist for ConstructConnect. He has delivered presentations throughout North America on the U.S., Canadian and world construction outlooks. Mr. Carrick has been with the company since 1985. Links to his numerous articles are featured on Twitter @ConstructConnx, which has 50,000 followers.


Recent Comments
comments for this post are closed