
In October, the measure everyone looks to as a gauge of inflation, the Consumer Price Index (CPI), was up +6.2% year over year, the fastest rate of advance in the U.S. in decades.
 Graphs Graphic")
Gasoline was pricier by half (+49.6%) compared with a year ago.
The purchase price of used cars and trucks was ahead by a quarter (+26.4%).
There will be outcries, but the news on the inflation front won’t really catch many people by surprise, given the amount of media coverage there’s been concerning supply shortages, unloading problems at ports and material input cost hikes.
There’s another element in inflation, though, that warrants more attention than it has been receiving, especially since it plays a dual role. I’m speaking of compensation rates.
Escalating wages contribute to price hikes, plus they become necessary to handle the increase in the general price level. As such, they are unique in that once set alight, they fuel an inflationary perpetual motion machine.
Tables 1 and 2 below show the year-over-year hourly and weekly earnings advances for U.S. ‘production and nonsupervisory workers’ in October. The phrase in quotation marks is a long way of saying that bosses are left out of the calculations.
Interestingly, from Table 1, the hourly advance for ‘total private’ jobs’ in the latest month was +5.8%, not much below the +6.2% gain for the CPI.
Among 12 industrial sub-sectors, construction was in the middle of the pack. It ranked 5th for level of hourly earnings and sixth for year-over-year change in hourly earnings.
From Table 2, concentrating on weekly earnings, construction ranked 4th for level and 7th for year-over-year percentage change.
Keep an eye out for instances of employee dissatisfaction. Some examples have already materialized. Included among companies that have experienced recent labor unrest have been Kellogg’s, John Deere and Kaiser Permanente. Plus, some carpenters walked off their job sites in Seattle.
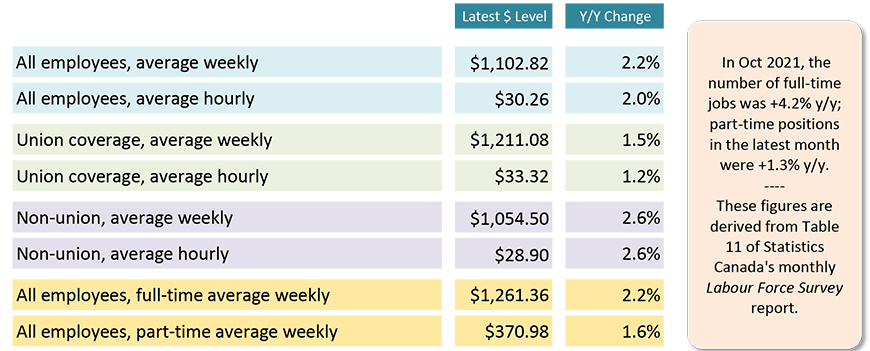
Table 3 shows earnings results for Canada but compiled with a somewhat different focus in mind. There’s an emphasis on union versus non-union affiliation and full-time versus part-time work.
To date in 2021, the Canadian compensation advances, according to Statistics Canada, have not been nearly as dramatic as in the U.S.
Canadian CPI results are not scheduled to be released until November 17th. They may not show quite the same outsized advances as the latest U.S. inflation results, but they’re sure to make headlines, nonetheless.
Evidence of the pricing frenzy is everywhere. A week ago, I was phoned by the manager of the dealership where I bought my last car. He wanted to buy back my vehicle, knowing he could resell it for a high price. The deal would only have made sense if it had also involved some refinancing, and a deal on another car, none of which I wanted to get involved with.
Nevertheless, that was a phone call I didn’t expect to be fielding. And the likes of which I’ve never previously encountered.
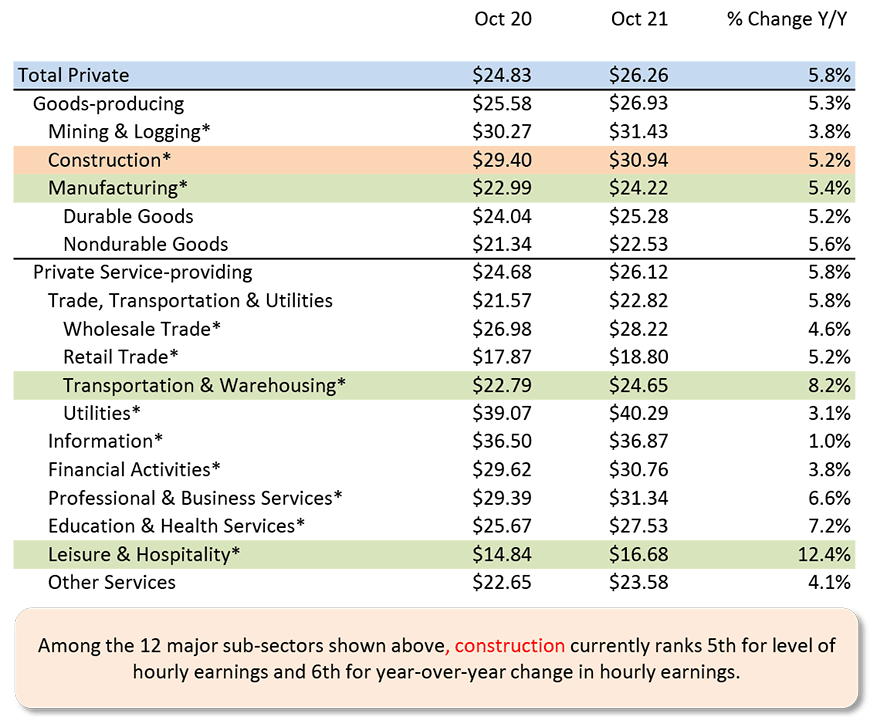
Chart: ConstructConnect.
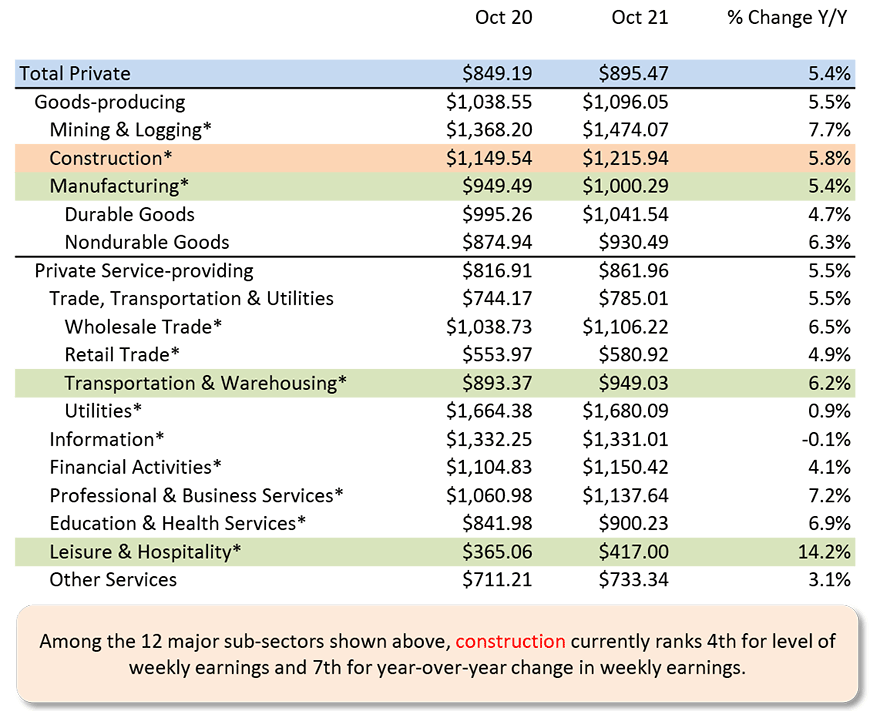
Chart: ConstructConnect.
Year over Year, October 2021
‘Current’ means there has been no scaling back to remove effects of inflation.
Table: ConstructConnect.
Table 4: U.S. and Canadian Jobs Markets – October 2021
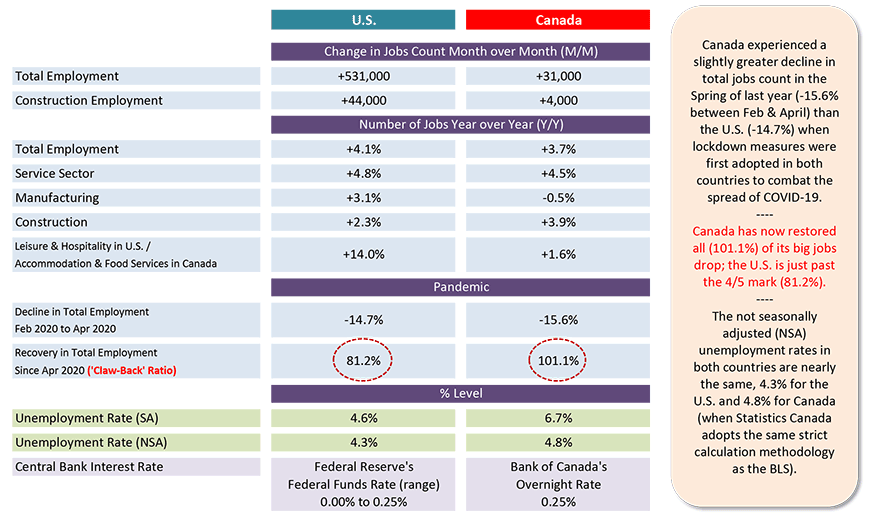
U.S. labor data is from a ‘payroll survey’ / Canadian labour data is from a ‘household survey’.
Canadian NSA unemployment rate ‘R3’ is adjusted to U.S. concepts (i.e., it adopts U.S. equivalent methodology).
Table: ConstructConnect.
Alex Carrick is Chief Economist for ConstructConnect. He has delivered presentations throughout North America on the U.S., Canadian and world construction outlooks. Mr. Carrick has been with the company since 1985. Links to his numerous articles are featured on Twitter @ConstructConnx, which has 50,000 followers.


Recent Comments
comments for this post are closed