In the Spring and Summer of this year, a huge gap opened between construction bid prices that were staying low on a year-over-year basis and material input costs, also y/y, that were soaring into the stratosphere.

Graph 1 shows the comparisons. The top curve records the average gain for two PPI series measuring construction material cost hikes. The bottom curve captures bid prices. The PPI code numbers are WPUIP231000, WPUSI012011 and WPUFD43.
Over the past several months, there’s been some downward adjustment in the materials cost structure. The top curve in Graph 1 descended from its peak, but then it did jog back upwards slightly in October. The bottom curve for bid prices has been increasing, with an especially big jump in the latest month, to +12.3% y/y.
Forestry products is where the first big and outrageous escalation in costs began earlier this year, with softwood lumber prices in May being +161% year over year.
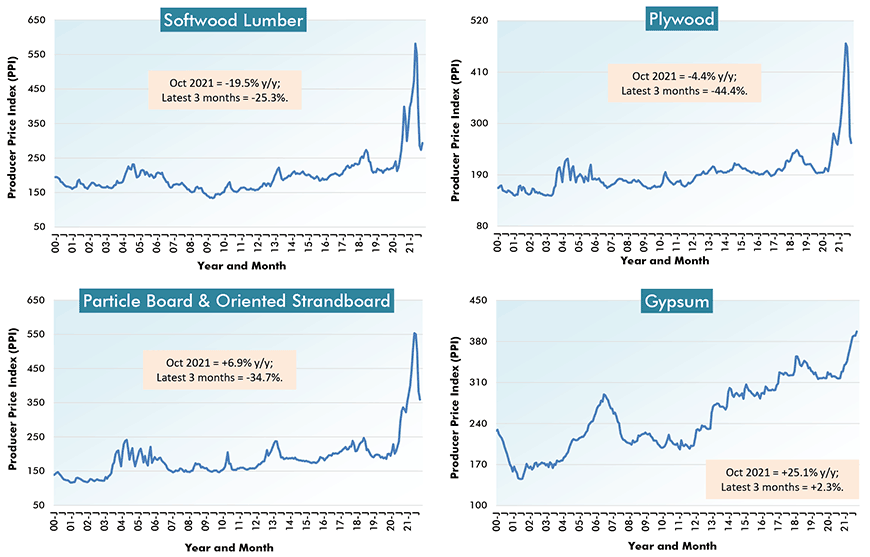
There’s been a sigh of relief at seeing the cost of softwood lumber turn -19.5% y/y in October and -25.3% during the past three months.
This doesn’t mean there will be a corresponding financial break for purchasers of new homes. U.S. sawmills supply only about 70% of the product needed for American homebuilding. Imports from Canada make up almost all the rest and the average tariff on shipments from north of the border has just been doubled from a rounded 9% to a rounded 18%.
Also, not all wood products have seen large price drops. Hardwood lumber and millwork, appearing as line items in Table 2 at the end of this article, are +45.6% y/y and +14.4% y/y respectively.
Also, even with their price retreats, softwood lumber, plywood and particle board/oriented strandboard are currently at levels higher than at any other time this century
Some other highlights from the latest PPI results include the following.
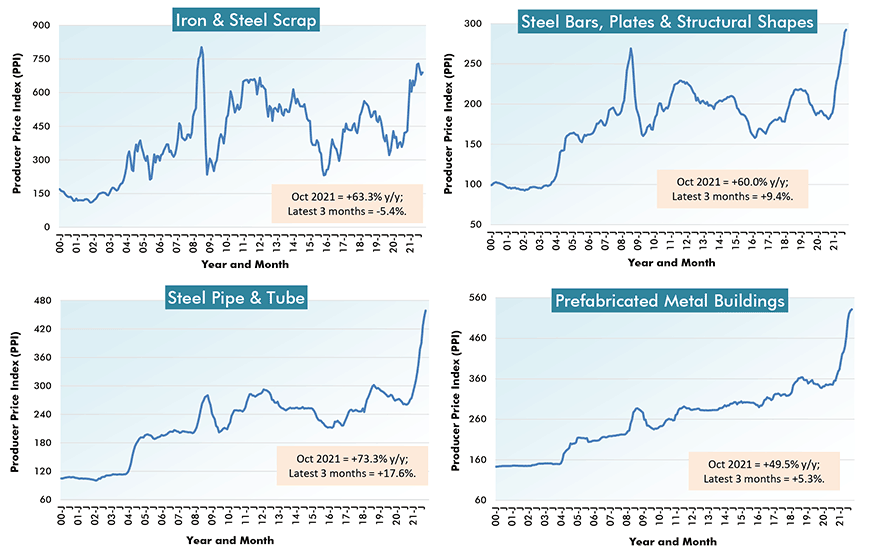
Among all construction inputs, steel products are displaying the most eye-catching cost climbs.
From Cluster Chart 2, ‘steel bars, plates and structural shapes’, ‘steel pipe and tube’ and ‘prefabricated metal buildings’ are all up by half or more year over year and their levels are at new peaks since turning into the 2000s.
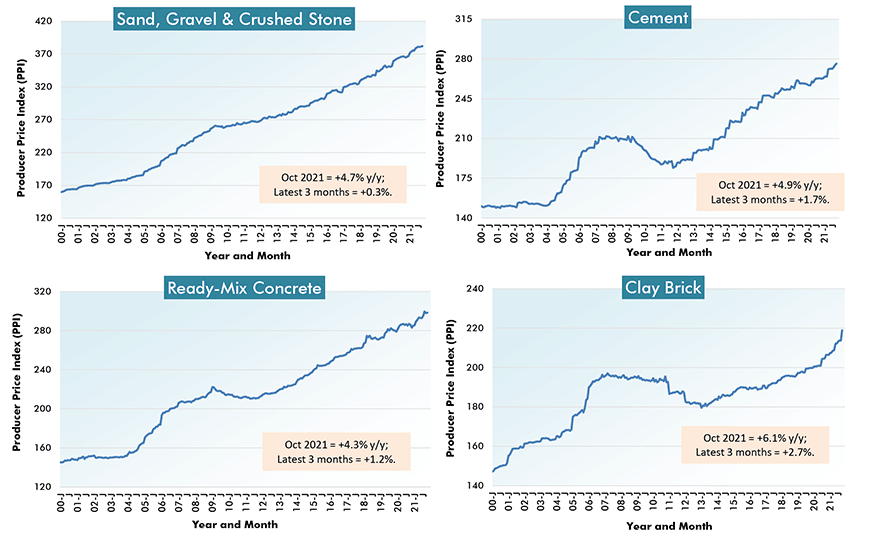
From Cluster Chart 3, cement and ready-mix concrete prices, while pulling ahead a bit, still remain relatively restrained compared with most other materials, +4.9% y/y and +4.3% y/y respectively.
There are two related products, however, which don’t appear in Cluster Chart 3, but which do make up line items in Table 2, precast concrete and prestressed concrete. The price of the former is +11.8% y/y; and of the latter, +12.5% y/y.
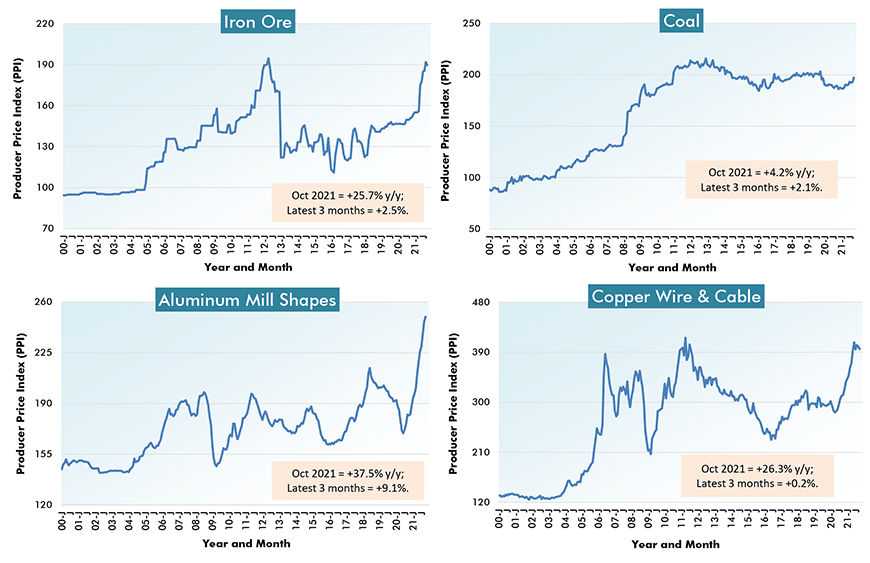
Cluster Chart 4 features an extraordinary take-off in the price of aluminum mill shapes, +37.5% y/y and +9.1% during the latest three months. Plus, the index level (which directly reflects the real-world price level) for aluminum mill shapes is a third higher than its previous peak in early 2018.
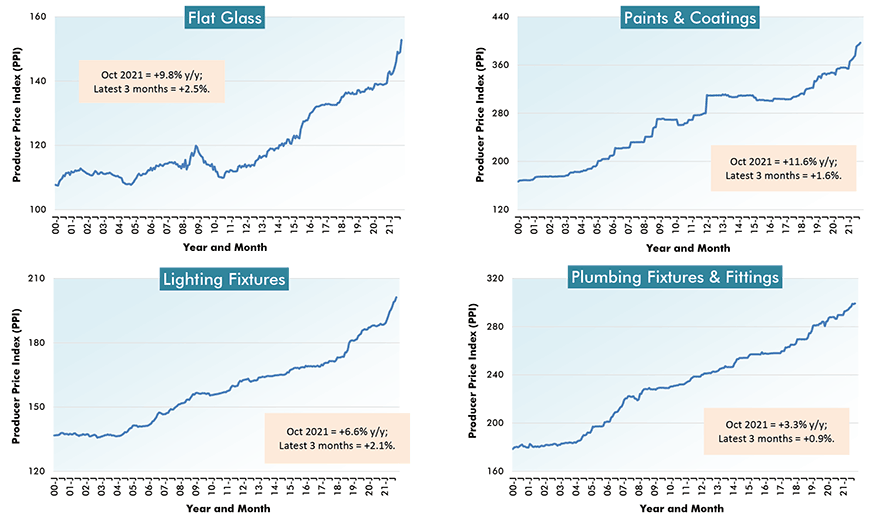
Highlights from Cluster Charts 5 through 7 include the +9.8% y/y leap for flat glass, which normally keeps a more sedate profile.
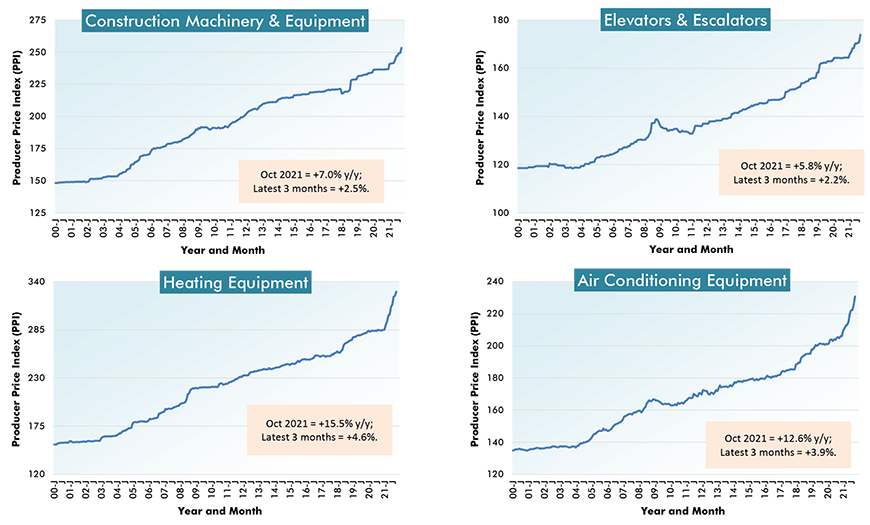
Heating equipment (+15.5% y/y) and air conditioning equipment (+12.6%) are two other product categories showing inordinately large year-over-year price hikes.
Finally, from the shaded-in-blue section at the top of Table 2, there are five sub-categories of bid price indices (i.e., the plainer way of saying ‘final demand’ indices) covering various types of structures.
At the low end, presently, are bid prices for ‘new school building’, +9.6% y/y. At the other and upper extreme are bid prices for new warehouses, +21.2% y/y.
During the pandemic, and with the stampede of retail trade to the Internet, the building of fulfilment and distribution centers has been one of the few truly strong bulwarks of nonresidential construction activity.
(Note: the best means to achieve Canadian equivalency is to draw on the Industrial Product Price Index (IPPI) data set from Statistics Canada – please view 1,000-Word Chart: Canadian Construction Material Costs.
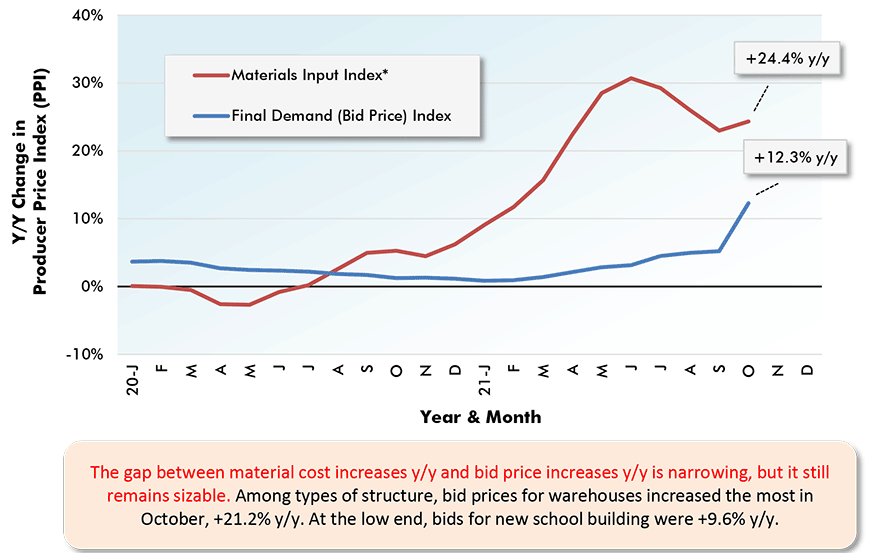
Chart: ConstructConnect.
From Producer Price Index (PPI) Series – October 2021
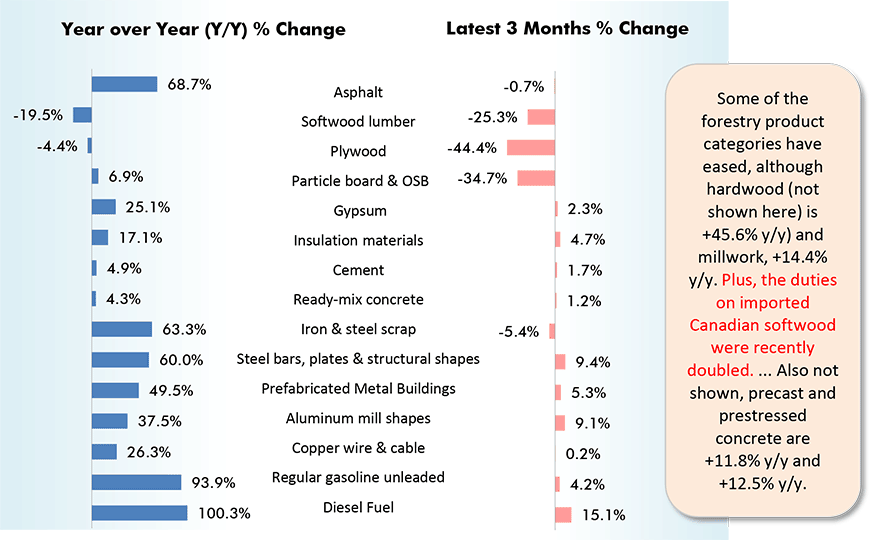
Table: ConstructConnect.
Charts: ConstructConnect.
Charts: ConstructConnect.
Charts: ConstructConnect.
Charts: ConstructConnect.
Charts: ConstructConnect.
Charts: ConstructConnect.
Charts: ConstructConnect.
% Change in the October 2021 Index from:
| 3 Years | 1 Year | 6 months | 3 months | 1 month | |||||
| Ago | Ago | Ago | Ago | Ago | |||||
| Final Demand/Service/Commodity/Energy/Input: | |||||||||
| Final Demand Construction | 18.1% | 12.3% | 9.8% | 6.9% | 6.6% | ||||
| New warehouse building construction | 27.2% | 21.2% | 18.1% | 13.3% | 13.0% | ||||
| New school building construction | 15.9% | 9.6% | 8.1% | 5.4% | 5.7% | ||||
| New office building construction | 17.4% | 12.1% | 8.6% | 5.4% | 5.8% | ||||
| New industrial building construction | 21.7% | 14.0% | 12.6% | 9.4% | 8.5% | ||||
| New health care building construction | 17.3% | 11.9% | 8.7% | 7.6% | 6.5% | ||||
| Architectural & engineering services | 5.6% | 3.7% | 0.9% | 0.6% | 0.6% | ||||
| Construction machinery & equipment | 10.8% | 7.0% | 4.9% | 2.5% | 1.6% | ||||
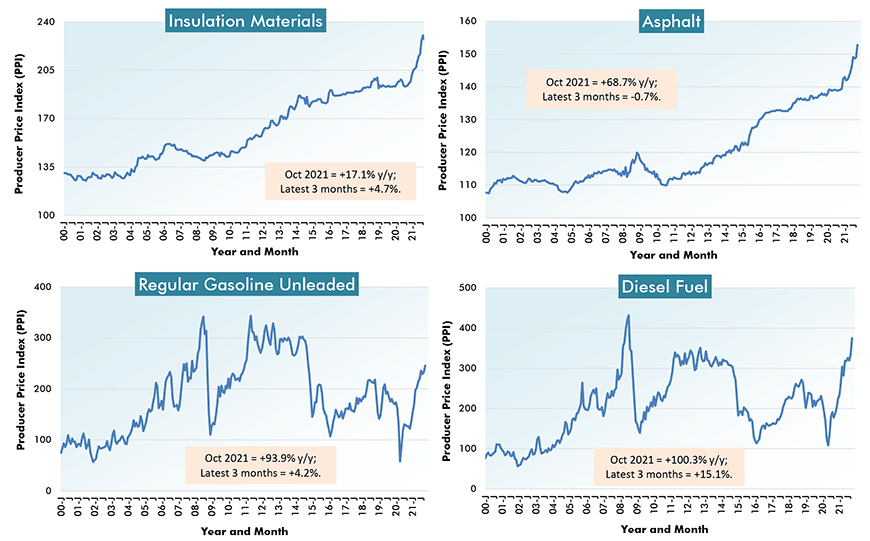
| Asphalt | -4.9% | 68.7% | 2.1% | -0.7% | -0.6% | ||||
| Plastic construction products | 37.2% | 30.3% | 17.7% | 7.0% | 2.5% | ||||
| Softwood lumber | 36.9% | -19.5% | -37.9% | -25.3% | 7.3% | ||||
| Hardwood lumber | 32.9% | 45.6% | 12.2% | 2.1% | 2.4% | ||||
| Millwork | 24.9% | 14.4% | 6.1% | -1.0% | 1.0% | ||||
| Plywood | 12.7% | -4.4% | -30.4% | -44.4% | -5.3% | ||||
| Particle board & oriented strandboard (OSB) | 75.6% | 6.9% | -19.2% | -34.7% | -6.3% | ||||
| Gypsum | 15.9% | 25.1% | 10.7% | 2.3% | 1.8% | ||||
| Insulation materials | 14.2% | 17.1% | 9.7% | 4.7% | -1.3% | ||||
| Construction sand, gravel & crushed stone | 13.0% | 4.7% | 1.9% | 0.3% | 0.3% | ||||
| Cement | 8.9% | 4.9% | 1.8% | 1.7% | 0.5% | ||||
| Ready-mix concrete | 10.0% | 4.3% | 1.7% | 1.2% | 0.1% | ||||
| Precast concrete products | 19.9% | 11.8% | 6.4% | 3.4% | 1.5% | ||||
| Prestressed concrete products | 14.1% | 12.5% | 3.4% | 1.3% | 1.1% | ||||
| Brick (clay) | 12.0% | 6.1% | 4.8% | 2.7% | 2.4% | ||||
| Coal | -2.1% | 4.2% | 3.6% | 2.1% | 2.3% | ||||
| Iron ore | 34.6% | 25.7% | 21.5% | 2.5% | -1.2% | ||||
| Iron & steel scrap | 38.9% | 63.3% | 9.2% | -5.4% | 1.5% | ||||
| Steel bars, plates & structural shapes | 34.4% | 60.0% | 25.4% | 9.4% | 1.2% | ||||
| Steel pipe & tube | 54.3% | 73.3% | 39.6% | 17.6% | 3.3% | ||||
| Fabricated structural metal products | 38.0% | 38.8% | 21.2% | 7.9% | 1.6% | ||||
| Prefabricated Metal Buildings | 46.2% | 49.5% | 24.5% | 5.3% | 0.6% | ||||
| Aluminum mill shapes | 22.4% | 37.5% | 18.4% | 9.1% | 1.4% | ||||
| Flat glass | 12.4% | 9.8% | 6.8% | 2.5% | 2.6% | ||||
| Paints, architectural coatings | 23.3% | 11.6% | 7.3% | 1.6% | 0.7% | ||||
| Lighting fixtures | 11.8% | 6.6% | 4.5% | 2.1% | 0.9% | ||||
| Plumbing fixtures & fittings | 10.5% | 3.3% | 1.9% | 0.9% | 0.2% | ||||
| Elevators & escalators | 11.5% | 5.8% | 3.3% | 2.2% | 1.9% | ||||
| Heating equipment | 20.7% | 15.5% | 9.0% | 4.6% | 1.5% | ||||
| Air conditioning equipment | 18.3% | 12.6% | 8.3% | 3.9% | 2.4% | ||||
| Copper wire & cable | 33.7% | 26.3% | 6.7% | 0.2% | -1.1% | ||||
| Regular gasoline unleaded | 12.7% | 93.9% | 21.3% | 4.2% | 5.5% | ||||
| Diesel Fuel | 38.1% | 100.3% | 33.0% | 15.1% | 12.0% | ||||
| Inputs to new construction | 23.6% | 18.2% | 6.4% | -1.4% | 0.9% | ||||
| Inputs to new residential construction | 22.4% | 14.2% | 3.3% | -4.8% | -0.1% | ||||
| Inputs to new non-res construction | 23.3% | 21.1% | 8.1% | 1.0% | 1.3% | ||||
| Inputs to commercial construction | 23.8% | 21.9% | 9.1% | 1.9% | 1.5% | ||||
| Inputs to healthcare structures | 23.6% | 19.9% | 7.8% | 1.0% | 1.3% | ||||
| Inputs to industrial structures | 24.2% | 20.6% | 8.9% | 2.1% | 1.3% | ||||
| Inputs to highways & streets | 18.5% | 21.3% | 8.6% | 1.4% | 1.0% | ||||
| Inputs to power & communication structures | 22.4% | 22.1% | 8.3% | 1.0% | 1.4% | ||||
| Inputs to educational & vocational structures | 24.2% | 18.8% | 6.7% | 0.2% | 1.3% | ||||
| Construction materials (PPI ‘Special Index’) | 34.8% | 30.6% | 10.2% | 2.0% | 1.2% |
The ‘service’, ‘commodity’ and ‘energy’ indices (in the middle section of the table) are based on ‘factory-gate’ sales prices.
The ‘input’ indices (at bottom) reflect costs faced by contractors. They exclude capital investment (i.e., machinery & equipment), labor & imports.
The ‘input’ indices are built up from the ‘service’ (design, legal, transport & warehousing, etc.) ‘commodity’ and ‘energy’ indices.
Table: ConstructConnect.
Alex Carrick is Chief Economist for ConstructConnect. He has delivered presentations throughout North America on the U.S., Canadian and world construction outlooks. Mr. Carrick has been with the company since 1985. Links to his numerous articles are featured on Twitter @ConstructConnx, which has 50,000 followers.


Recent Comments
comments for this post are closed