
U.S. Permits Still Setting the Pace for Starts
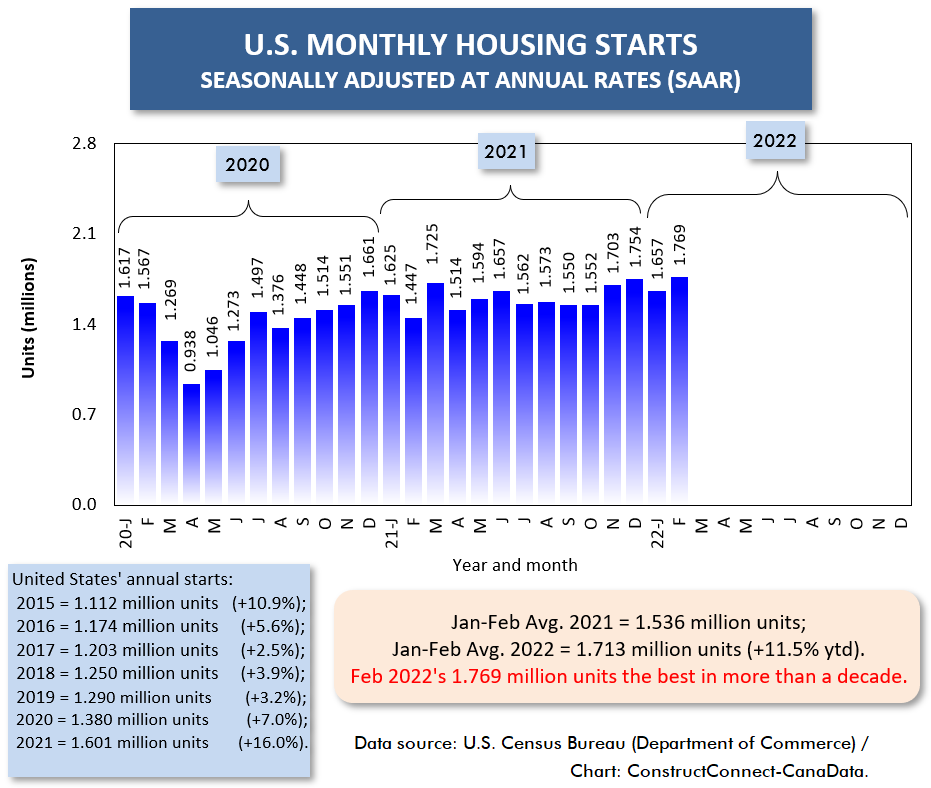
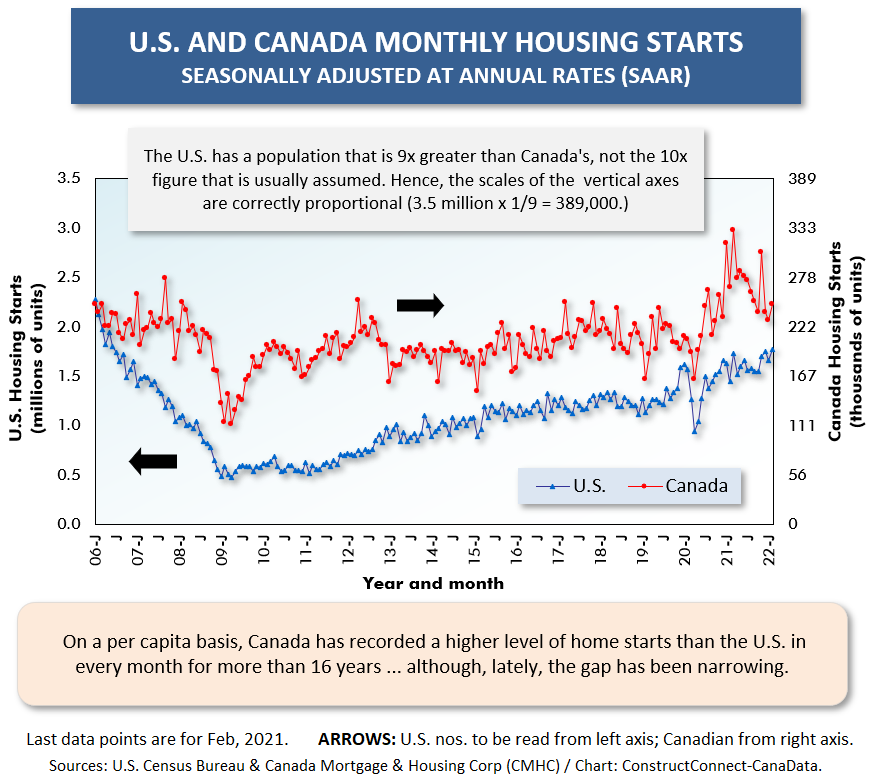
The average of seasonally adjusted and annualized (SAAR) housing starts in the U.S. through the first two months of 2022 has been 1.713 million units, +11.5% versus January-to-February of 2021.
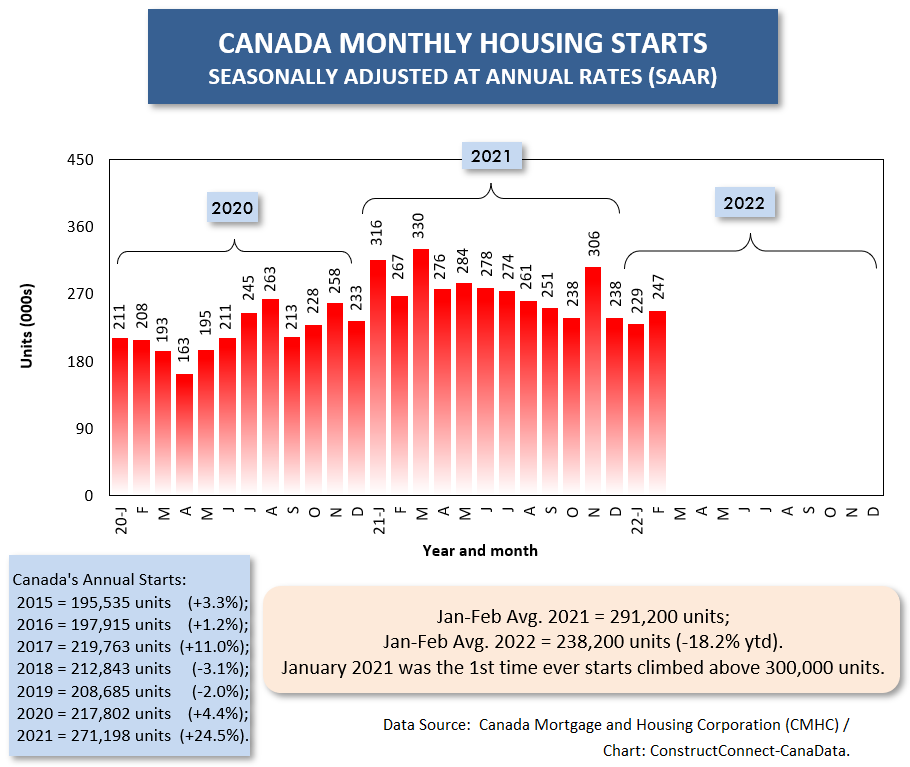
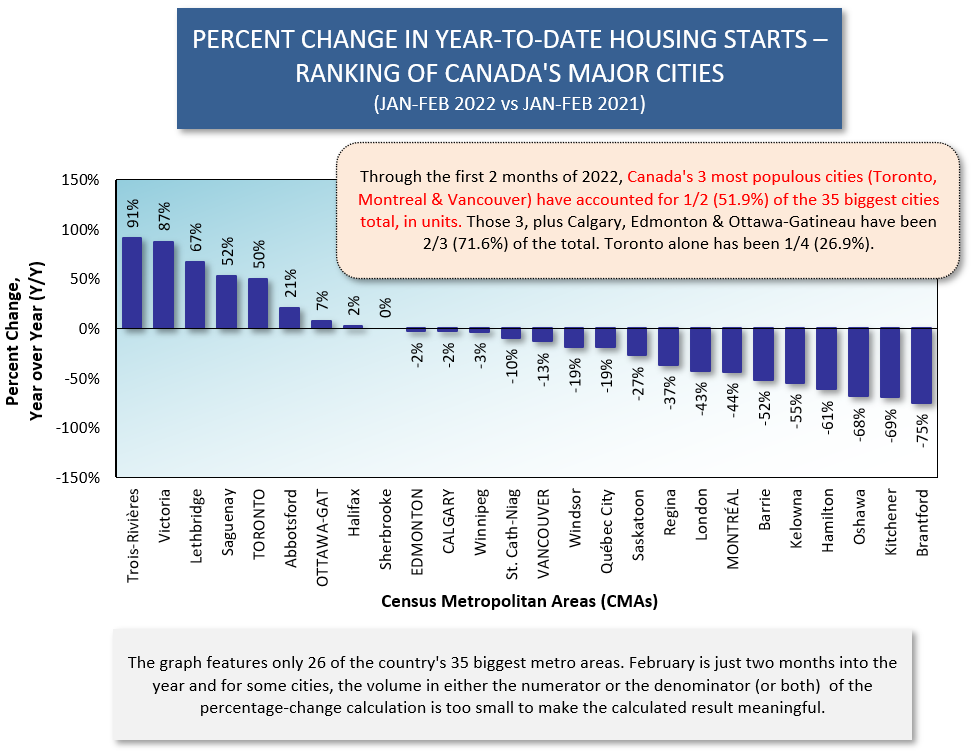
 Canada’s comparable 2022 performance has been 238,200 units, -18.2% on a year-to-date basis versus 2021’s same time frame.
The U.S. in February of this current year managed its highest monthly number (SAAR), at 1.769 million units, since before the 2008-2009 recession. Canada, in its monthly readings so far in 2022, has yet to come close to the 300,000-unit level it busted beyond on three occasions in 2021.
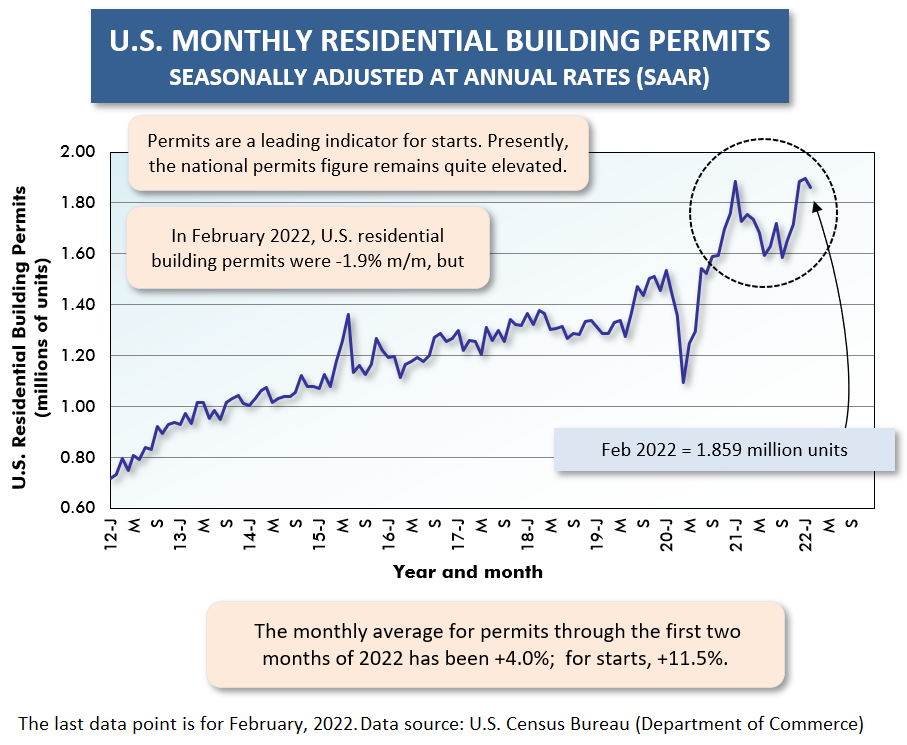
Graph 4 suggests ongoing good news for U.S. housing starts. Residential building ‘permits’, which often lead starts, are near 1.9 million units.
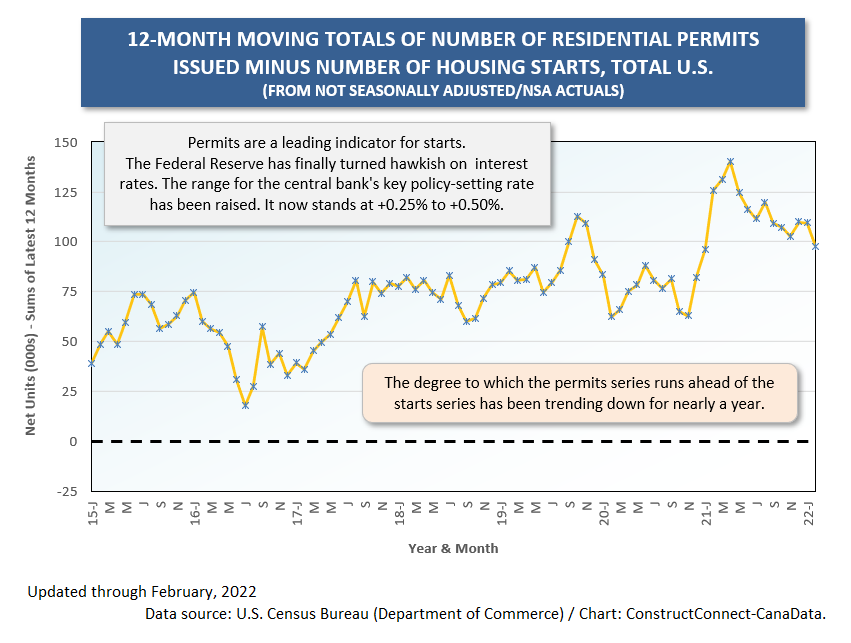
Graph 5, however, which also deals with permits, is not as bullish. Graph 5 shows the 12-month moving total of the difference between permits and starts, using ‘actual’ rather than SAAR numbers.
In Graph 5, there’s still a healthy positive gap between permits and starts, but it has been gradually decreasing.
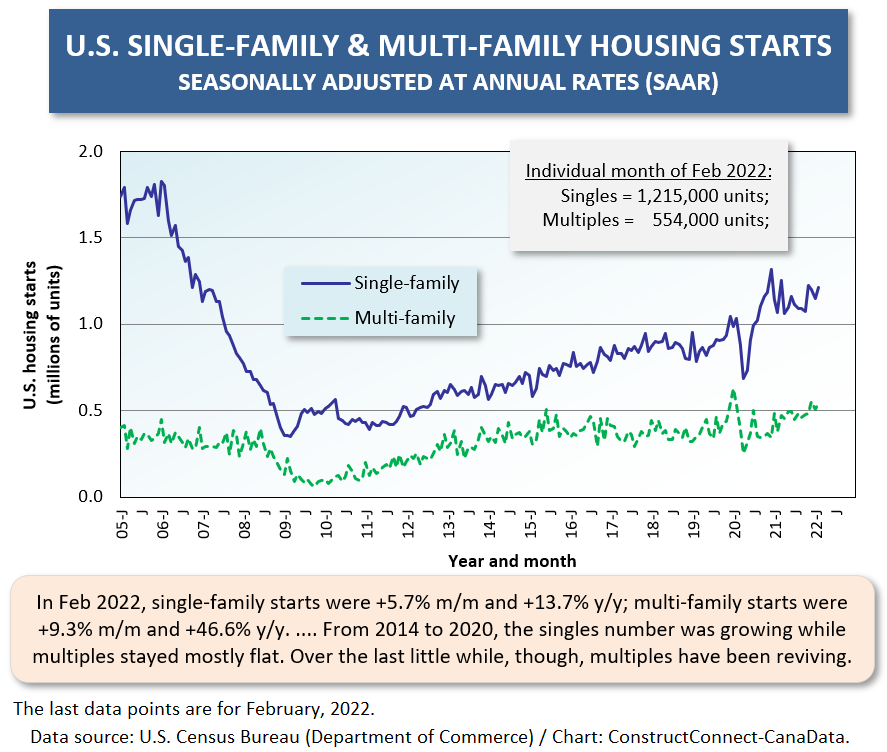
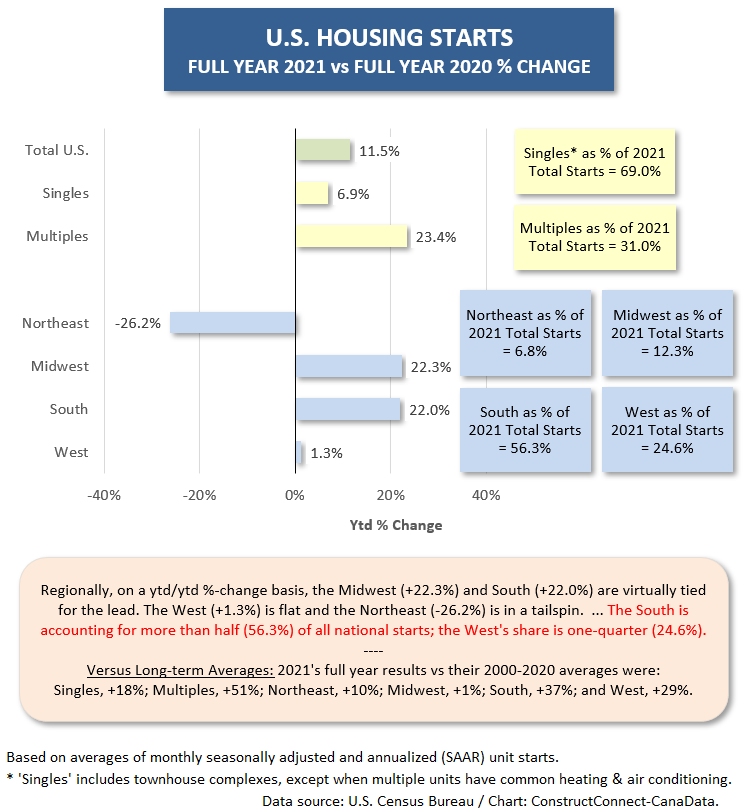
From Graph 6, the pickup in U.S. ‘multi-family starts year to date, +23.4%, has been more dramatic than in single-family starts, +6.9%.
Regionally, it’s been the Midwest and South virtually tied for the lead in percentage gain, based on number of units, +22.3% to +22.0% respectively. The West has been flat, +1.3%; the Northeast has been in a tumble, -26.2%.
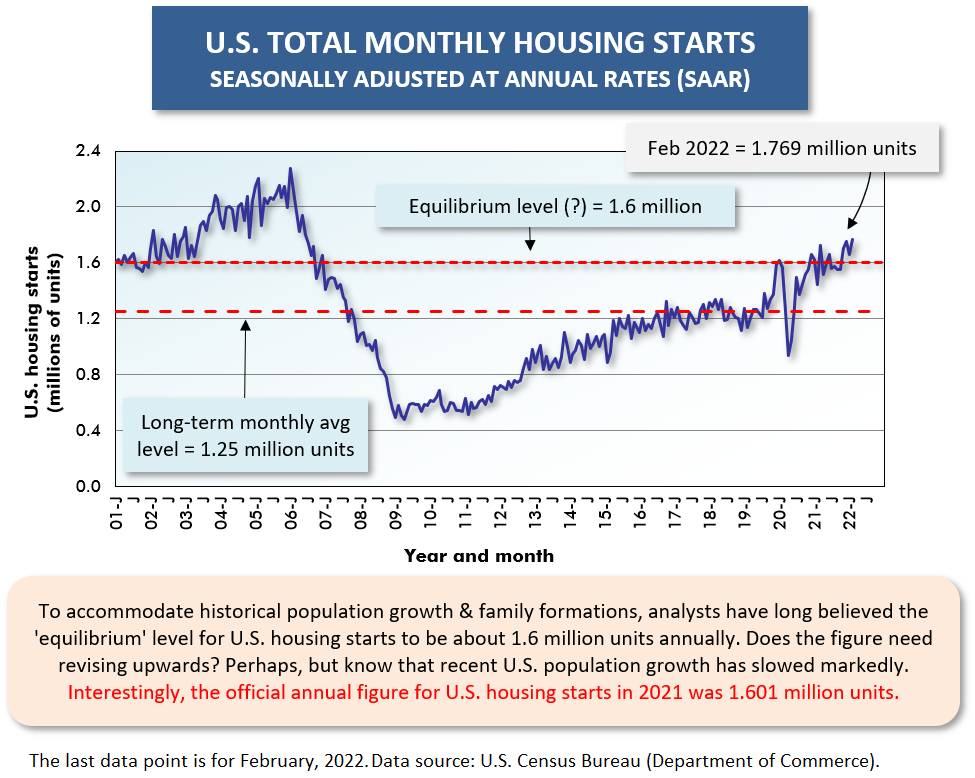
As an interesting sidebar, the text box in Graph 2 highlights that last year’s U.S. total housing starts figure is easy to remember. It was almost exactly 1.6 million units.
Graph 1
Graph 2
Graph 3
Graph 4
Graph 5
Graph 6
Canada’s Construction Activity & CMA Population Growth Rates
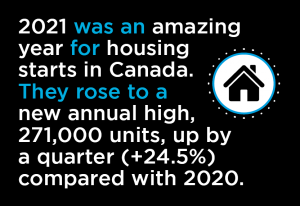
2021 was an amazing year for housing starts in Canada. They rose to a new annual high, 271,000 units, up by a quarter (+24.5%) compared with 2020.
One of the key ingredients contributing to the success of Canadian housing starts continues to be strong population growth. Statistics Canada has released its 2021 census results for population counts in cities across the country. Versus 2016, the number of urban centers labeled as census metropolitan areas (CMAs) has been increased from 35 to 41.
A CMA encompasses both a downtown core and a local band of ‘bedroom’ communities. The overall population must be 100,000 or more, with at least 50,000 living ‘where the action is’, at the center.
In the years of the 00s, Alberta was the province with the fastest annual rate of population growth. Now, that title goes to British Columbia.
B.C.’s heightened status as an ‘urban’ hub is demonstrated by its pickup in number of cities with a CMA designation. As a result of the latest census findings, Nanaimo, Kamloops, and Chilliwack have been upgraded to CMA status, to go along with Vancouver, Victoria, Kelowna, and Abbotsford.
B.C. is home to 7 CMAs, which moves it into second place among the provinces. Except, Quebec has six ‘standalone’ CMAs, but also a seventh when Gatineau is included. Ottawa-Gatineau is one CMA, but it’s located in both Ontario (mainly) and Quebec (less so, but to a still significant degree).
Ontario remains the champion with 17 CMAs. The Atlantic region has 5 CMAs, Alberta 3, Saskatchewan 2, and Manitoba 1.
Some of the other CMA population highlights from the latest census results, versus five years prior (i.e., 2021 vs 2016), are set out in the following bullet points.
- Toronto with a population of 6.2 million is by far the country’s biggest CMA. Montreal is well back in second place with 4.3 million. Vancouver, with 2.6 million, is in third spot. Toronto’s figure is 90% of the sum of Montreal and Vancouver. (In other words, it’s nearly as big as the other two cities combined.)
- Toronto CMA’s population gain between 2016 and 2021 was +4.6%, not as remarkable as one might suppose. But the population growth in CMAs within Toronto’s immediate orbit has been outstanding. Over the five years, Oshawa’s increase has been +9.3%; Guelph, +9.0%; and Barrie, +8.0%. Heading west along Highway 401, Kitchener’s gain has been +9.9% and London’s, +10.0%.
- A recent article in the New York Times spoke of Toronto as the fourth largest population center in North America, after Mexico City, New York, and Los Angeles. It also credited Toronto with being the third largest high-tech hub, after NYC and Silicon Valley. The latter assessment came from a count of tech workers carried out by CBRE.
- C. CMAs have claimed four of the top 5 spots for 2016-to-2021 total population gain. In first place has been Kelowna, +14.0%; in second position, Chilliwack, +12.1%; then tied for third, along with London, Ontario, are Kamloops and Nanaimo, +10.0% each.
- Two cities in the Atlantic region have been standouts for population growth: Halifax, +9.1%, and Moncton, +8.9%.
- The three Canadian CMAs ranked fourth through sixth for population levels have almost the same resident counts: Ottawa-Gatineau, 1.488 million; Calgary, 1.482 million; and Edmonton, 1.418 million. As for five-year pop growth, it’s been the nation’s capital, Ottawa-Gatineau, at +8.5%, beating Edmonton, +7.3%, and Calgary, +6.4%. Calgary’s economic prosperity is closely tied to the oil patch. 2015 through 2020 proved to be difficult years. Presently, though, the price of oil is shooting upwards once again.
- The CMA with the strongest five-year growth record in the province of Quebec has been Sherbrooke, +7.2%.
Among Census Agglomerations or CAs (i.e., communities the next size down from CMAs), the greatest five-year gains in population have occurred in Squamish, B.C., +21.8%; Wasaga Beach, Ontario, +20.3%; Tillsonburg, Ontario, +17.3%; Canmore, Alberta, +14.3%; and Collingwood, Ontario +13.8%. In some of those centers, the population explosions have placed demands on essential services, such as water supply, beyond what local public utilities have been able to easily provide.
Graph 7
Graph 8
Graph 9
Alex Carrick is Chief Economist for ConstructConnect. He has delivered presentations throughout North America on the U.S., Canadian and world construction outlooks. Mr. Carrick has been with the company since 1985. Links to his numerous articles are featured on Twitter @ConstructConnx, which has 50,000 followers.


Recent Comments
comments for this post are closed