
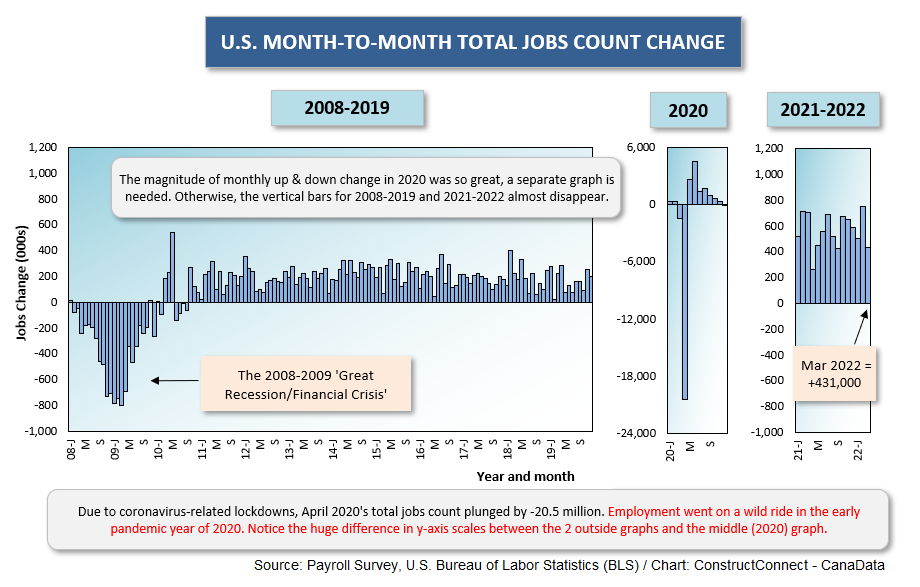
As reported by the Bureau of Labor Statistics (BLS) in its latest Employment Situation report, the total number of jobs in the U.S. rose by +431,000 in March. While that’s a wonderfully large number, it should be noted that it’s lower than the gain in any month since September of last year. (The monthly average increase, October 2021 to February 2022, was +633,000 jobs.)
Graph 1
 The seasonally adjusted (SA) unemployment rate has tightened to 3.6% from 3.8% in February. A year ago, the SA U rate was 6.0%.
The not seasonally adjusted (NSA) unemployment rate is now 3.8%, down from 4.1% the month prior and well below the 6.2% of March 2021.
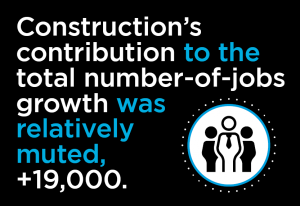
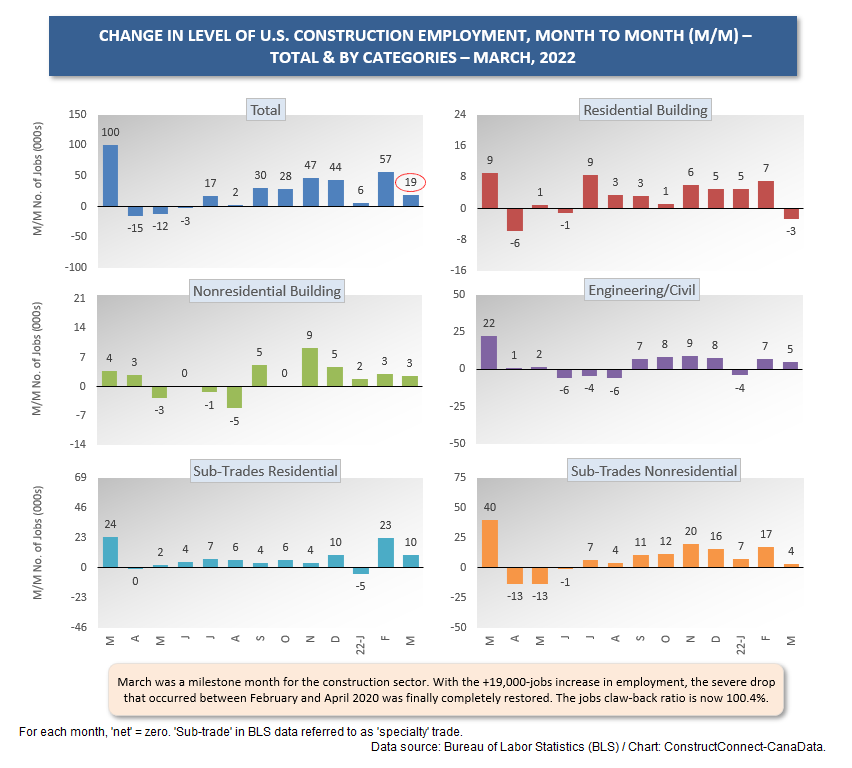
Construction’s contribution to the total number-of-jobs growth was relatively muted, +19,000. The only sub-category that carried out much of a hiring increase was residential specialty trade contractors, with a staffing increase of +10,000 jobs.
Graph 2
Among industrial sectors, the biggest nominal increase in employment in March came in leisure and hospitality, +112,000 jobs. Not far behind was professional and business services, with +102,000 jobs.
Manufacturing’s increase of +38,000 was exactly double construction’s advance of +19,000.
The not seasonally adjusted unemployment rate in construction now stands at 6.0%, down from 6.7% in February and a decent improvement versus March 2021’s 8.6%.
The NSA unemployment rate in manufacturing is 3.1%, versus the prior month’s 3.2% and the year-ago figure of 5.2%.
The most notable change in NSA U rates occurred in the ‘mining, quarrying and oil and gas exploration’ sector. It fell to just 2.6% in March after being 5.0% in February. But that’s not the attention-grabbing move. It shifted down to 2.6% in the latest month after being 15.0% in March of last year. The fighting in Ukraine, with accompanying concerns about energy supplies and wild gyrations in oil prices is an incentive for domestic firms to get back in the development game.
Table 1
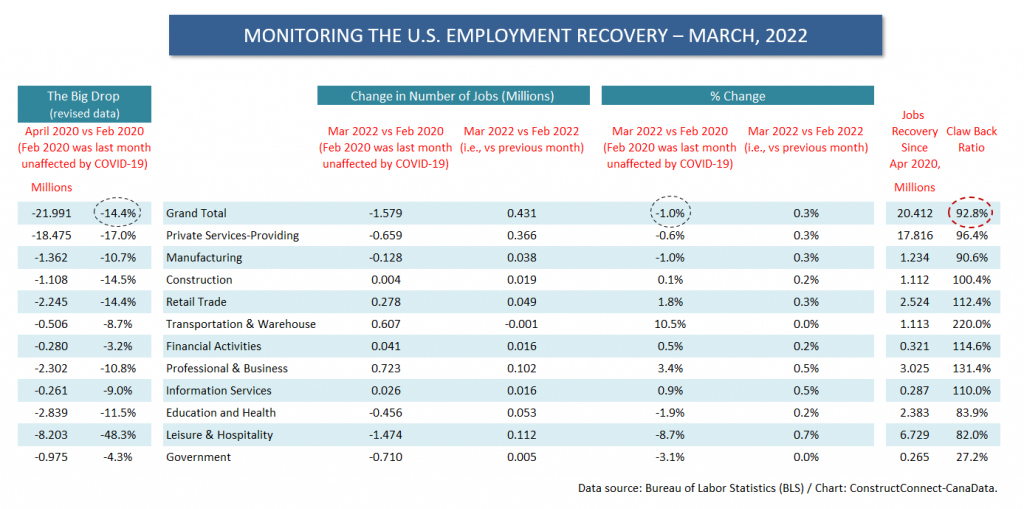
Versus the enormous setback in employment between February and April of 2020, when the coronavirus laid waste across the jobs landscape, the recovery ratio has improved to 92.8%.
For the construction sector, March was a milestone month. Construction’s jobs claw-back ratio has risen to 100.4%, meaning the recovery process is complete. The level of total employment in construction is now back to where it was before the onset of the health crisis in Spring 2020.
Manufacturing still has a few miles to travel before its employment level will be fully restored. Its claw-back ratio sits at 90.6%
‘Leisure and hospitality’ is another sector with a jobs claw-back ratio, at 82.0%, that’s leaving a lot of room for further pickup.
Also, with a present jobs claw-back ratio of only 27.2%, there’s been little restoration of the decline in government employment that occurred in Spring 2020. But the percentage drop that occurred then for the public sector (-4.3%) was much lower than for almost all portions (i.e., except financial activities, down only -3.2%) of the private sector.
The wage increases set out in March’s jobs market report continued to be substantial, but not mind-blowing. In the table for both production workers and supervisors, the year-over-year all-jobs compensation increases were +5.6% hourly and +4.6% weekly. Construction workers as a subset were in the same ballpark, +5.7% hourly and +4.1% weekly.
From the Employment Situation report’s Table B-8, for only production workers (i.e., leaving out bosses), the all-jobs gains were +6.7% hourly and +5.8% weekly. Construction workers didn’t fare quite as well, at +6.2% hourly and +4.6% weekly. (In February, the weekly earnings increase for construction workers was +10.6% y/y.)
Stock market investors, who wallowed in concerns in January and February, are once again liking what they’re seeing in the overall economy. Good jobs growth translates into solid income performance that will be spent on items to keep GDP growth momentum on track.
The DJI, S&P 500 and NASDAQ are retreated on a month-to-month basis in the first two periods of this year. But in March, from opening to close, the DJI was +2.3%; the S&P 500, +3.6%; and NASDAQ, +3.4%.
Alex Carrick is Chief Economist for ConstructConnect. He has delivered presentations throughout North America on the U.S., Canadian and world construction outlooks. Mr. Carrick has been with the company since 1985. Links to his numerous articles are featured on Twitter @ConstructConnx, which has 50,000 followers.


Recent Comments
comments for this post are closed