
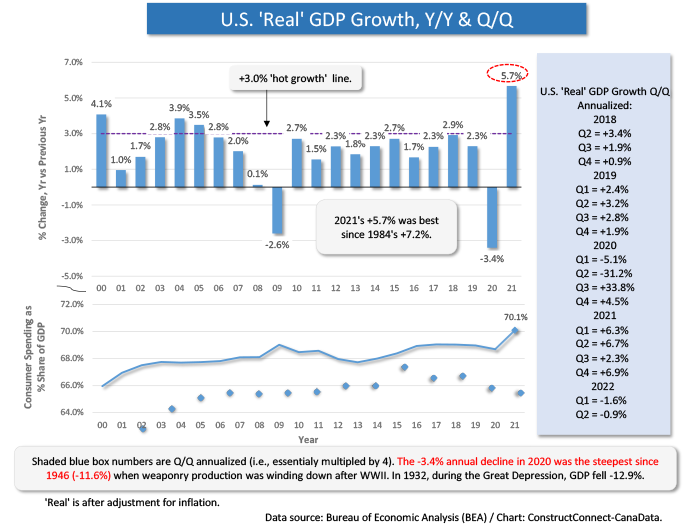
U.S. ‘real’ (i.e., inflation adjusted) gross domestic product (GDP) contracted by -0.9% in the second quarter of this year, on the heels of a -1.6% slide in the first quarter. (By way of contrast, Q4 2021 pulled ahead by +6.9%).
 Two quarters in the red is the economics textbook definition of a recession. But it’s not a recession until the National Bureau of Economic Research says it is. The NBER is the arbiter of when exactly recessions begin and end; of when cycles shift from upbeat to downbeat and back again, etc.
The 2022 Q2 ‘advance estimate’ GDP numbers from the Bureau of Economic Analysis (BEA) have private investment in nonresidential structures declining for the fifth quarter in a row. The latest q/q result was -11.7%.
Residential construction investment in Q2 2022 was also in the hole, -14.0% q/q, but the explanation isn’t as obvious as one might suppose. There’s a fair amount of esoterica buried in the line items of GDP. Understanding all the ins and outs of what makes up GDP is a study all on its own. The latest quarter’s residential investment pullback, according to the BEA, was due mainly to a decline in brokers’ commissions.
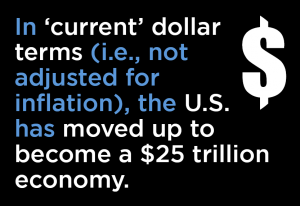
In ‘current’ dollar terms (i.e., not adjusted for inflation), the U.S. has moved up to become a $25 trillion economy. Personal Consumption Expenditures (PCE) as a share of the total in Q2 were 68%.
There are price deflators to convert ‘current’ dollars to ‘constant’ dollars for the line items of GDP. The quarter-to-quarter change in the ‘private’ (as opposed to ‘government’) nonresidential structures line item has eased considerably. It remains high, but it has downshifted from +24.4% in Q4 2021 to +18.2% in Q1 2022 and +15.8% in Q2 2022.
The residential investment price index is now +13.7% q/q, after being +18.2% in this year’s Q1.
Personal saving as a percent of disposable (i.e., after-tax) personal income has returned to a more reasonable level, 5.2%. The figure maxed out at 20.5% in Q1 2021,
The fact the savings rate soared so high, to annual levels of 16.6% and 12.3% in 2020 and 2021 respectively, accounts for much of our present inflationary difficulties. While everyone was sheltering at home in the early stages of the pandemic, they were accumulating piles of cash. There was nowhere to fly off to and no venues for entertainment.
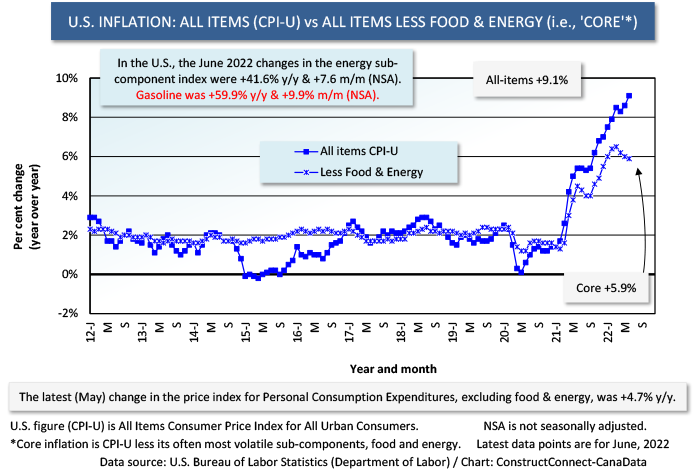
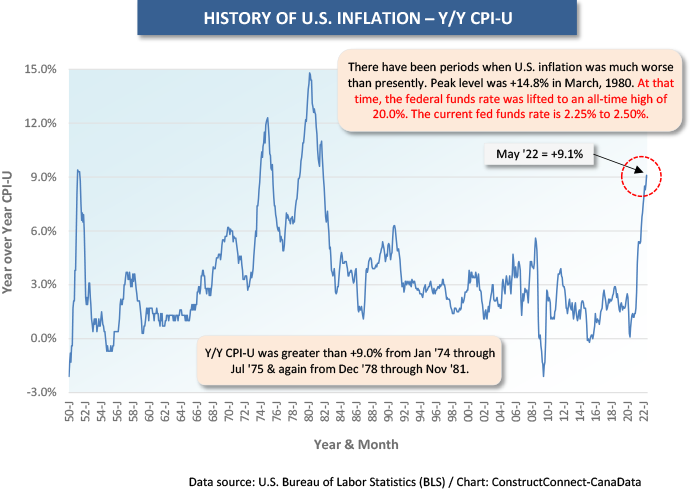
The eventual setting free of those cash reserves created an excess of demand (see accompanying Graph 5) that overwhelmed supply chains and distribution systems, unleashing the price increases that have driven CPI-U to +9.1% year over year.
Charged with keeping inflation in check, the Federal Reserve has increased its federal funds rate (i.e., its key policy-setting rate) to a range that runs from 2.25% to 2.50. (Not so long ago, it was zero percent.)
The most recent step up was +75 basis points (where 100 basis points = 1.00%). Another 75-bps hike may come in September, but according to the Fed, it will be data driven. In other words, it may be open to adjustment depending on inflation indicators at the time and on how well the jobs market is holding up.
A big part of the Fed’s job is to talk tough, to convince everyone that unruly inflation will be wrestled to the ground; that it won’t become deeply entrenched and linger on forever.
Given the latest quarterly GDP numbers, the economy is obviously slowing down. That alone alleviates many of the supply shortage issues.
Inverted Yield Curve
In financial markets, there’s the dreaded ‘inverted yield curve’ to confront. This is just a fancy way of saying short-term rates have been rising above long-term rates. Usually, it’s the other way around, with people and corporate entities receiving an extra reward for being willing to tie up their money for a long period of time.
Many analysts read an inverted yield curve as a sure sign of imminent recession. History has shown, though, that there’s no such thing as certainty in these matters. Furthermore, today’s economic circumstances, coming out of a pandemic-induced vacuum, are like nothing ever experienced before.
One thing to be aware of is that the U.S. ‘core’ inflation rate, which ignores many of the most violent price movements in food and energy, has come down for three months in a row, and now sits at +5.9% y/y.
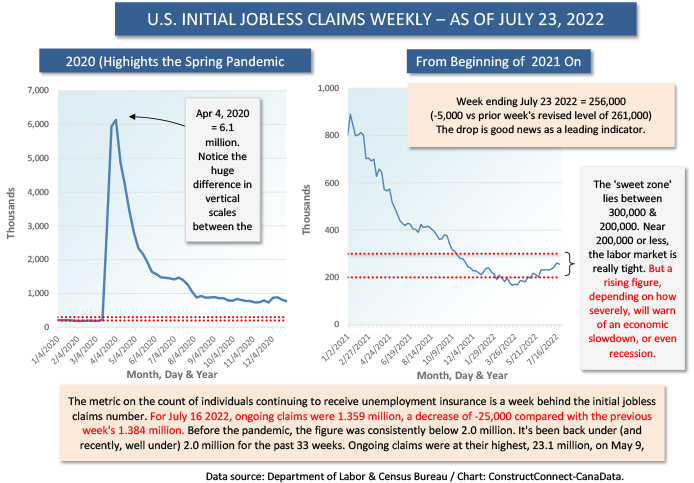
Also, while the initial jobless claims figures have generally been creeping up since the end of Q1 this year, the latest tally for the week ending July 23rd marked a decline of -5,000. And the latest count of individuals receiving unemployment insurance retreated, by -25,000.
CHIPS and Construction
In the construction sector, there’s good news from the passage of the CHIPS Act in the Senate. If ratified by the House, this will provide an array of incentives to firms engaged in the manufacturing of semiconductors. Intel indicated it was stalling on a go-ahead for a giant plant in Ohio, until it was sure that CHIPS was a done deal.
With tensions heating up between the U.S. and China, relying on South Korean (SK Innovation) and Taiwanese (TSMC – Taiwan Semiconductor Manufacturing Co.) chipmakers as primary sources of the component that controls the operation of cars, appliances, fighter aircraft and so on, has been seen as inadvisable. (A new strategic order is heeding the lesson learned from Germany’s dependence on Russian natural gas.)
To Delay or Not to Delay
I’m often asked these days whether the owners behind major capital spending initiatives might be better off to put things on hold for a while; to wait for material input costs, labor skills imbalances and interest rates to settle down again.
I don’t have a definitive answer. I guess it depends on each decision-maker’s risk tolerance.
But I do know that the more projects are delayed now, especially ones crucial to a long-term vision, the potential for a bunching up of major undertakings in a year or two’s time will expand enormously and possibly/probably lead to a new set of headaches.
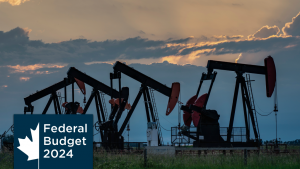
Finally, stock markets may be under the weather, but the big oil companies are doing just fine, profit-wise that is. As my dear sweet Aunt Edna would say, “There’s always someone doing better than you are. Don’t be jealous. Live with it.”
Graph 1
Graph 2
Graph 3
Graph 4
Graph 5
Graph 6
Graph 7
Alex Carrick is Chief Economist for ConstructConnect. He has delivered presentations throughout North America on the U.S., Canadian and world construction outlooks. Mr. Carrick has been with the company since 1985. Links to his numerous articles are featured on Twitter @ConstructConnx, which has 50,000 followers.


Recent Comments
comments for this post are closed