The City of Vancouver is the most heavily regulated municipality in the Lower Mainland for residential development and is stifling new homebuilding, according to a recent survey of homebuilders released by the Fraser Institute.
The New Homes and Red Tape in British Columbia: Residential Land-Use Regulation in the Lower Mainland ranks the City of Vancouver last among 19 of the region’s municipalities when it comes to residential development regulations.
"Increasing housing supply in Vancouver could help lower prices, but unfortunately there are a lot of confusing and costly regulations on the books that deter new homes from being built," said Kenneth Green, a senior research director at the Fraser Institute and co-author of the study.
According to the red tape ranking, the City of Vancouver has the longest building permit approval times in the Lower Mainland, with an average of 21 months followed by West Vancouver (18.3 months) and Surrey (13.2 months).
The City of Langley had the shortest approval times, with typical approvals averaging less than two months.
"Compared to the City of Langley, it takes an average of 19 months longer to receive a building permit in Vancouver — a fact that should worry anyone concerned about high home prices in the city because the added time means extra costs that are ultimately passed on to homebuyers," Green said.
Vancouver also has the highest level of opposition to new residential development from city council and community groups.
Moreover, the city has the highest costs, on average, to comply with residential development regulations. Estimates show it costs almost $78,000 for every new unit of housing built, whereas the typical cost of regulatory compliance in Port Moody, New Westminster, Pitt Meadows and the City of Langley is less than $10,000 per unit.
Even in neighbouring Burnaby, typical compliance costs are approximately $15,000 per unit of new housing.
"If municipal councils in the Lower Mainland, especially in Vancouver, really want to increase the supply of housing, they should consider more sound regulatory regimes that encourage — not stifle —residential development," Green said.
Vancouver recently announced new efforts to improve its process. In 2016, the city saw a two per cent increase in permit applications over 2015, the second highest volume it has seen to date. For 2017, initial data shows that permit applications may out pace last year.
To improve the process, the city intends to prioritize affordable housing development, simplify policies and regulations for low density housing, create more district schedules to replace rezoning policies in community plans and review the system for establishing development charges.
The city also intends to expand new online tools to allow developer support and communicate service targets.
Green declined to comment on the specifics of the city’s strategy.
"In this survey, we’re not really evaluating ‘efforts’ so much as outcomes," said Green.
"We feel this is the best way to gauge whether policies are working. At the end of the day, if whatever changes the city of Vancouver results in shorter building permit approval timelines, more efficient costs and fees, less (or less impactful) rezoning, then they can be considered successful."
However, Green noted that based on the responses the institute collected between 2014 and 2016, this does not seem to be the case
"But it is great that some municipalities are identifying this issue as a priority," he said.
Green stated it is too soon to say if the problem overall in municipalities is getting better or worse. He explained that the study builds on data from the institute’s initial analyses in 2015.
He said an important first step is for citizens to recognize that house prices reflect the interaction of both demand and supply as a growing number of bidders on a dwindling number of property listings means prices go up.
"This issue will improve as citizens and their local governments demand action to free up supply, rather than focusing solely on tempering demand," he said.
"I think that the debate over housing prices in Canada, and the limited amount of affordable housing has intensified, which suggests a perception that things are either getting worse, or failing to improve. But we’ll need a few more years and considerably more data before we can quantitatively discuss trends, one way or the other."
Red Tape Rankings from least to most
According to the New Homes and Red Tape in British Columbia: Residential Land-Use Regulation report, the following are Lower Mainland municipalities ranked from least to most regulated:
1. City of Langley
2. Pitt Meadows
3. New Westminster
4. Port Moody
5. Port Coquitlam
6. Chilliwack
7. Delta
8. Mission
9. Abbotsford
10. Burnaby
11. Maple Ridge
12. District of North Vancouver
13. City of North Vancouver
14. Coquitlam
15. Richmond
16. Langley Township
17. Surrey
18. West Vancouver
19. Vancouver
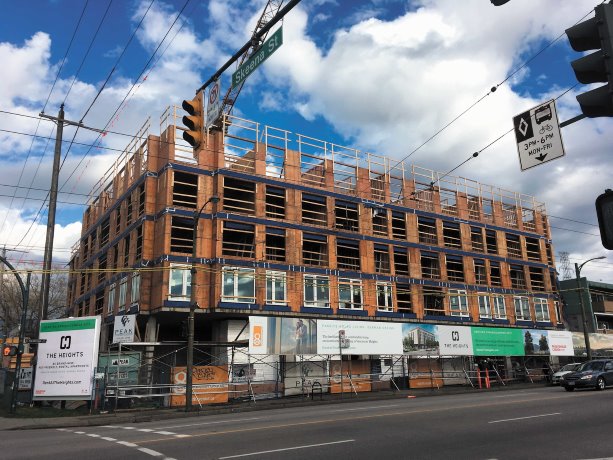
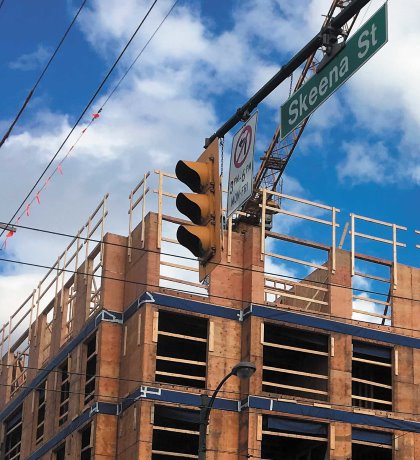
Crews work on The Heights, a six-storey condo project being developed by Eight Avenue Development Group in Vancouver. A new study by the Fraser Institute argues that the city is the most expensive and time consuming municipality in the Lower Mainland for residential development.
Photo: File Photo"


Recent Comments
comments for this post are closed