Mirror, mirror on the wall what is the greenest (not the fairest) country of them all? This question was prompted by a recent article in The Economist which focussed on U.S. climate policy which, after President Trump withdrew from the Paris Agreement, was generally considered to have gone up in a cloud of coal-fired smoke. However, despite the fact that the President has consistently expressed skepticism about climate change, greenhouse gas (GHG) emission in the U.S. fell by 2.7% in 2017, the largest drop among the G7 group of major developed countries.
Although Mr. Trump was president during 2017, there is little to suggest that he had anything to do with the drop in GHG emissions that year. As The Economist article and several others point out, CO2 emissions in the U.S. have been trending steadily lower over the past ten years, primarily because power plants in the U.S. have been shifting away from “dirty” coal to cheaper, cleaner natural gas. Indeed, ten years ago, U.S. consumption of natural gas was roughly equal to that of coal. Now it is more than double.
The most notable aspect of this shift from dirty coal to cleaner natural gas is that it was driven primarily by the free market and not by government regulations. Note that the Clean Power Plan authored by the Obama administration was never implemented.
In addition, more efficient energy use has been promoted by non-profits such as the Green Building Council. Since 2007, natural gas prices have dropped by almost 60% while over the same period, the price of coal has increased by just under 30%. Largely due to this relative increase in the price of coal vis-à-vis natural gas, close to 40% of U.S. coal-generating capacity has been, or is scheduled to be, removed from service and no U.S. electrical utility has plans to build any more.
Despite the fact that CO2 emissions declined more during the last ten years in the United States (-13.5%) than they did in the rest of the countries in the Group of 7, many including The Economist are calling for a carbon tax to “encourage” the U.S. to further reduce its carbon footprint, as outlined in the Paris Agreement.
While this is a laudable goal, it is unlikely to appeal to a majority of Americans because a tax on carbon will raise both personal and commercial transportation costs, as well as their home heating and cooling costs, which according to the U.S. Energy Information Administration (EIA) account for two-thirds of residential home energy use. In addition, it would increase the competitive disadvantage of U.S. manufacturers, already having difficulty competing against cheaper imports, mostly from Asian countries.
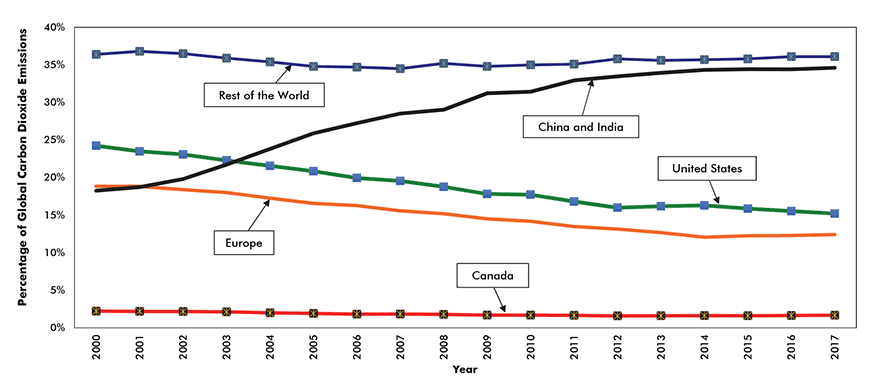
To gauge the challenge facing those attempting to reduce global carbon dioxide emissions by whatever means, it is useful to examine the emission patterns of the major geographic regions over the past ten years.
Turning first to North America, since 2007 and largely due to the above mentioned drop in U.S. emissions, annual CO2 output has declined by 740 million tons (10.8%). As a result, the U.S. share of global CO2 output fell from 22.8% to 18.3%.
Over the same period, emissions in Europe have fallen by 536 million tons (11.4%) and now account for 12.3% of global emissions compared to 15.6% in 2007. While CO2 emissions have fallen in Europe, North America and also in the Commonweath of Independent States (CIS), they have trended higher in the remaining four major regions.
Since 2007, CO2 emissions in the Asia Pacific region have risen by 3.7 gigatons (29%) primarily on account of increased CO2 production in China (+2 gigatons) and India (+1 gigaton). Indeed, those two countries are responsible for 89% of the net increase in CO2 over the past ten years.
While both countries have signed on to the Paris Accord, they are currently in the process of building or planning to increase their carbon footprints by continuing to add to their already very large number of coal-fired generating stations over the next five to ten years.
According to a New York Times article published in mid- 2017 and a report prepared in September of this year by CoalSwarm, a global network of researchers focussed on fossil fuels and alternatives, China is currently in the process of adding 259 Gigawatts of coal-fired generating capacity, approximately equal to the total amount of U.S. coal-fired capacity. Turning to India, according to the International Energy Agency, “no country is likely to contribute more to the growth in energy demand in the next two decades than India and no country will contribute more to the increase in global CO2 emissions.
Given the very strong prospect that increased CO2 production in China and India will continue to overwhelm efforts to reduce it in the rest of the world, it appears that the only strategy to mitigate the adverse impact of climate change is to build more weather-resistant infrastructure and be better prepared to deal with climate-driven catastrophic events.
Shares of Global CO2 Emissions from China and India, the United States, Europe, Canada and Rest of the World

Chart: ConstructConnect — CanaData.


Recent Comments
comments for this post are closed