This Nuggets report is being written on Valentine’s Day, so let me begin by expressing my hope that you, my valued reader, and your special someone share moments today that are truly memorable.

Okay, with that out of the way, and thoughts of roses and chocolates dancing in my head, let’s move on to the economy.
Census Bureau employees have returned to work post-shutdown, but it will take a while for them to bring all their key data releases up to date. At time of writing, there are fresh numbers for retail sales (see point 6 below), but not for foreign trade or housing starts.
Thank goodness the Bureau of Labor Statistics (BLS) has been fully functional over the past month-and-a-bit and there are plenty of statistics on jobs, the unemployment rate, and consumer and producer prices.
Plus, there’s a wealth of material to be gleaned from private sector sources. Therefore, without further ado, – I still need to go out and purchase an iTunes gift card so my wife and I can download a romantic movie – let’s move on to some prime recent data bytes.
(1) The U.S. economy generated 307,000 net new jobs in January and the year-over-year climb in employment was +1.9%. The construction workforce’s jobs improvement was +4.7%, the fastest of all major industrial sub-sectors. The number of heavy-engineering construction employees jumped by +7.4% year over year. ConstructConnect’s Top 10 Projects starts lists over the last couple of years have increasingly featured mega-sized energy-related projects (e.g., pipelines; ethane plants; petrochemical plants; etc.).
(2) In what corners of the economy have other outsized increases in employment been occurring? The biggest leaps have come in: biotechnology research and development, +9.1%; warehousing and storage, +8.2%; courier and messenger delivery services, +7.0%; machinery and equipment rental, +6.9%; aerospace products and parts manufacturing, +6.7%; oil and gas extraction, +6.2%; software publishing, +6.1%; and waste management, +5.2%.
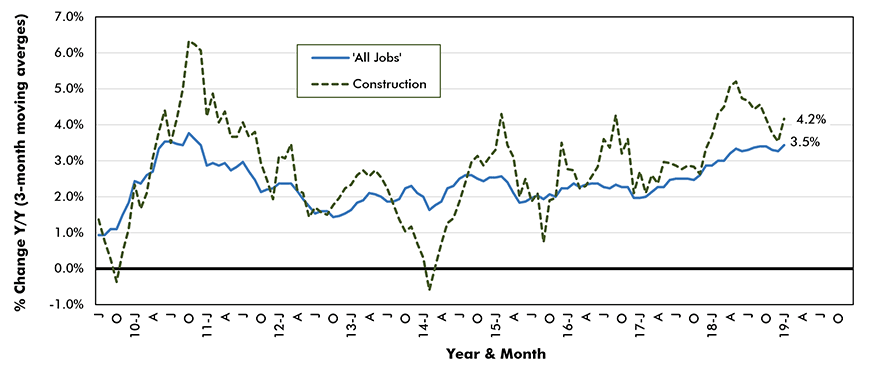
(3) With jobs growth strong, and the unemployment rate meager (5.0%), wages should be rising rapidly, right? Not quite. They are on an upswing, but they’re sauntering rather than soaring. The graph below shows the year-over-year changes in average weekly compensation for all jobs in the U.S. economy versus construction specifically. Among the variety of wage data compiled by the BLS, average weekly earnings for production workers and non-supervisory personnel (i.e., excluding bosses) have been showing the greatest hikes. For ease of viewing, the series in the graph have been smoothed by taking three-month moving averages of the year-over-year results.
(4) As can be seen from the graph, average weekly earnings for construction workers have been keeping pace with or exceeding ‘all jobs’ increases over the past three years. Furthermore, it’s apparent that both curves have been trending higher since 2016. Construction’s current three-month average gain is +4.2%, beating the ‘all jobs’ increase of +3.5%. The ‘unsmoothed’ average weekly earnings increase for construction in the standalone month of January 2019 was +5.6%, almost two percentage points above the +3.7% for ‘all jobs’
Graph 1: Average Weekly Earnings Y/Y – ‘All Jobs’ versus Construction

(5) If wages are heating up, is it finally time to start worrying about inflation again? Not according to the January report on the U.S. Consumer Price Index (CPI). The all-items CPI is only +1.6% year over year. A rise of +2.0% is considered perfectly acceptable. The ‘core’ inflation rate, which monitors ‘non-food and energy’ items, is a little sprightlier, at +2.2%. (Food and energy goods are omitted in the ‘core’ rate because they have wide and largely uncontrollable up-and-down swings in prices.) The most recent performance of all-items inflation has been restrained by declines in energy, -4.8% y/y, especially gasoline, -10.1%.
(6) From a jobs perspective, the U.S. economic waters appear buoyant. Why, then, are so many analysts jittery about the future? There are other numbers to consider and some have become less exuberant. Consider U.S. retail sales. There were a lot of negative percentage changes in December’s just-released report. (Be aware that the big wave of holiday shopping in the last month of the year is muted by the seasonal adjustment process.) While total U.S. seasonally-adjusted retail sales were +2.1% year over year in December 2018, they were -1.3% month to month. Electronic and appliance store sales were +0.7% y/y, but -0.1% m/m; food and beverage store sales were +1.4% y/y, but -0.4% m/m; and perhaps most telling of all, ‘non-store retailer’ sales (made by merchants selling mainly over the Internet) were +3.7% y/y, but -3.9% m/m.
(7) It never rains, but it pours. Steel buyers have been challenged to find adequate supply of their sought-after building material at a reasonable price after the imposition of first-strike and retaliatory tariffs by many of the world’s major industrial countries (e.g., the U.S., Canada, Europe and China). Now there is a new threat to steel prices from a deadly dam collapse in southeastern Brazil that is interrupting Vale SA’s ability to supply iron ore to steelmakers. Iron ore producers in other countries, especially Australia (i.e., the main out-of-country source of supply for Chinese steelmaking firms), are attempting to ramp up production.
(8) While the world awaits new U.S. housing starts information, a look at existing-home sales seems warranted. According to the National Association of Realtors (NAR), completed-transaction resale activity (for single-family, townhouse, condo and co-op properties) in December 2018 was -6.4% compared with November and -10.3% relative to December 2017. Unit sales in December 2018 were 4.99 million, tailing off significantly from the 5.56 million of 12 months earlier. Late last year, the Federal Reserve seemed intent on initiating several interest rate hikes throughout 2019. A hawkish prospect for mortgage rates, which would worsen affordability, dampened homebuying enthusiasm. The Fed has since tuned neutral with respect to interest rate moves, waiting to receive guidance from the latest metrics on the economy.
(9) Canada’s total jobs count in January was +67,000, a year-over-year bounce of +1.8%. Some sub-sectors with extraordinary 12-month boosts in hiring, according to Statistics Canada, have been: home health care, +9.2%; software publishing, +8.6%; investigation services, +7.1%; computer systems design services, +7.0%; community care for the elderly, +4.8%; aerospace products and parts manufacturing, +4.3%; and movie, video and music production, +4.2%.
(10) Canada’s annual housing starts have been within plus or minus 20,000 of 200,000 units for nine years now, dating back to 2010. In 2017 and 2018, they were 220,000 and 213,000 units respectively. In the first month of 2019, Canadian new home groundbreakings were 208,000 units. In the nation’s six largest population centers, the only urban areas with more than a million residents each, the latest month’s home-starts percentage changes versus January 2018 were: Montreal, +81% (all cropping up in the multi-family, as opposed to single-family, market); Edmonton, +10%; Calgary, +8%; Toronto, +1%; Vancouver, -20%; and Ottawa-Gatineau, -62%.


Recent Comments
comments for this post are closed