Three Countries in Front Rank of Trade with U.S.
Three countries compete for pre-eminence in foreign trade with the United States. Not surprisingly, they are the two neighbors on either side of the U.S., Canada and Mexico, and the nation with the second largest (behind America) gross domestic product (GDP) in the world, China.
The NAFTA agreement has been rewritten to become the USMCA accord and, with a few hiccups − i.e., threatened, but not enacted, tariffs on Mexico to encourage crackdowns on migrations to the U.S. border − sales transactions between the three North American compatriots is being normalized. Original and retaliatory tariffs on steel and aluminum will soon disappear.
Tariffs on a wide range of products from China, however, remain in place, and may be widened and lifted further if an agreement on market access and intellectual property protections is not reached by the time of the G-20 meeting at the end of June.
Also view the dynamic web story page here: Is China the number one U.S. Trading Partner?
Among U.S. Export Customers, China Well Back of Canada and Mexico
How important is China to U.S. foreign trade?
Table 1 highlights that both Canada and Mexico are far bigger customers for U.S. exporters than Chinese clients. Through April of this year, Canada has accounted for nearly 18% of U.S. goods export shipments and Mexico, nearly 16%. China is in third spot, well back at 6.2%.
Nor was the share of U.S. exports taken by China (7.8%) within striking distance of either Canada (18.3%) or Mexico (16.0%) during the first four months of last year.
Also, it’s worth noting from Table 1 that no other country besides Canada, Mexico or China takes more than 5% of U.S. goods export shipments.
Finally, Canada and Mexico combined, through the initial four months of 2019, have purchased an impressive one-third (33.8%) of total U.S. products shipped outside the country.
Table 1: Top Dozen Customer Countries for U.S. Goods Exports
Current $ Billions USD
| Rank | Country | Jan-Apr 2018 | Jan-Apr 2019 | % Change | Share of TOTAL | Share of TOTAL | |||||
| Based on | Ytd Last Year | Ytd This Year | |||||||||
| Column E | A | B | C | D | E | ||||||
| 1 | Canada | $98.9 | $97.5 | -1.4% | 18.3% | 17.9% | |||||
| 2 | Mexico | $86.4 | $86.2 | -0.2% | 16.0% | 15.9% | |||||
| 3 | China | $42.3 | $33.9 | -19.9% | 7.8% | 6.2% | |||||
| 4 | Japan | $23.3 | $24.0 | 3.0% | 4.3% | 4.4% | |||||
| 5 | United Kingdom | $22.8 | $23.4 | 2.4% | 4.2% | 4.3% | |||||
| 6 | Germany | $19.5 | $20.5 | 5.0% | 3.6% | 3.8% | |||||
| 7 | South Korea | $17.4 | $18.4 | 5.9% | 3.2% | 3.4% | |||||
| 8 | Netherlands | $16.0 | $17.6 | 10.6% | 3.0% | 3.2% | |||||
| 9 | Brazil | $12.4 | $13.3 | 7.5% | 2.3% | 2.4% | |||||
| 10 | France | $11.2 | $13.1 | 16.8% | 2.1% | 2.4% | |||||
| 11 | Belgium | $10.6 | $12.2 | 15.4% | 2.0% | 2.2% | |||||
| 12 | India | $9.8 | $12.0 | 22.0% | 1.8% | 2.2% | |||||
| Rest of World (ROW) | $169.6 | $171.6 | 1.1% | 31.4% | 31.6% | ||||||
| TOTAL | $540.2 | $543.6 | 0.6% | 100.0% | 100.0% |
Data source: U.S. Bureau of Economic Analysis (BEA).
Table: ConstructConnect.
China is Number One as Source of U.S. Goods Imports
On the import side of the foreign trade ledger, however, there is an elevation of China’s status.
Reading from the far-right column of Table 2, the proportion of total U.S. imports originating in China has been 17.4% through April of this year. That’s ahead of the import shares coming from second-place Mexico (14.5%) and third-place Canada (12.5%).
After Canada, there’s a big step down to the next significant source of U.S. imports, Japan (6.1%). Beyond China, Mexico, Canada and Japan (and the latter, just barely), no other country supplies the U.S. with more than 6.0% of total goods imports.
From Column C of Table 2, the new tariff regime has reduced the value of U.S. goods imports from China by -12.7% year to date. As a result, China’s share of total U.S. goods imports has slipped to 17.4% to date in 2019 from 20.1% during the same January-to-April time frame of 2018.
Table 2: Top Dozen Countries Supplying U.S. Goods Imports
Current $ Billions USD
| Rank | Country | Jan-Apr 2018 | Jan-Apr 2019 | % Change | Share of TOTAL | Share of TOTAL | |||||
| Based on | Ytd Last Year | Ytd This Year | |||||||||
| Column E | A | B | C | D | E | ||||||
| 1 | China | $161.3 | $140.8 | -12.7% | 20.1% | 17.4% | |||||
| 2 | Mexico | $110.3 | $117.0 | 6.1% | 13.7% | 14.5% | |||||
| 3 | Canada | $103.5 | $101.1 | -2.3% | 12.9% | 12.5% | |||||
| 4 | Japan | $47.1 | $49.0 | 4.0% | 5.9% | 6.1% | |||||
| 5 | Germany | $41.4 | $41.7 | 0.8% | 5.1% | 5.2% | |||||
| 6 | South Korea | $22.7 | $26.6 | 17.0% | 2.8% | 3.3% | |||||
| 7 | United Kingdom | $19.6 | $20.9 | 6.4% | 2.4% | 2.6% | |||||
| 8 | France | $16.9 | $19.8 | 17.0% | 2.1% | 2.4% | |||||
| 9 | India | $17.6 | $19.7 | 12.2% | 2.2% | 2.4% | |||||
| 10 | Ireland | $18.9 | $19.1 | 1.0% | 2.3% | 2.4% | |||||
| 11 | Italy | $17.3 | $18.5 | 6.9% | 2.2% | 2.3% | |||||
| 12 | Taiwan | $14.0 | $17.1 | 22.1% | 1.7% | 2.1% | |||||
| Rest of World (ROW) | $214.0 | $216.4 | 1.1% | 26.6% | 26.8% | ||||||
| TOTAL | $804.5 | $807.5 | 0.4% | 100.0% | 100.0% |
Data source: U.S. Bureau of Economic Analysis (BEA).
Table: ConstructConnect.
China’s Share of U.S. Goods Trade Deficit Falling, But …
It’s not the trading-partner shares of exports or imports that are causing problems for the U.S. economy on the foreign trade front. Rather, the headache comes from the negative gap between total exports and total imports.
China is, by far, the biggest source of that minus spread.
Graph 1 shows America currently running a monthly deficit in ‘goods and services’ foreign trade of about -$600 billion, seasonally adjusted and annualized (SAAR). Furthermore, the -$600 billion shortfall is net of a +$250 billion surplus in ‘services’ trade (i.e., consultancy fees, tourism, etc.)
The deficit in ‘goods’ trade alone is more than -$850 billion (SAAR).
The U.S. is often close to trade balance with Canada, is down modestly with Mexico (which usually yields around 10% of the U.S. deficit) but is in a deep hole with China.
From Graph 2, China’s share of the U.S. goods trade deficit in April 2019 was more than one-third of the total (36.4%), far surpassing any other country.
Those in favor of the tariffs, however, will be quick to point out that China’s share of the U.S. goods trade deficit has been reduced dramatically from the 45% to 50% range that was common earlier.
There’s more to the story, though. China hasn’t stood still on its side of the trade war. Beijing has introduced measures to deny U.S. access to its marketplace. This has been especially painful for American hog and soybean farmers.
The -12.7% drop in imports from China should be viewed in the context of a -19.9% decline in U.S. exports to the Middle Kingdom.
Graph 1: United States’ Foreign Trade: Goods and Services Balance − April 2019
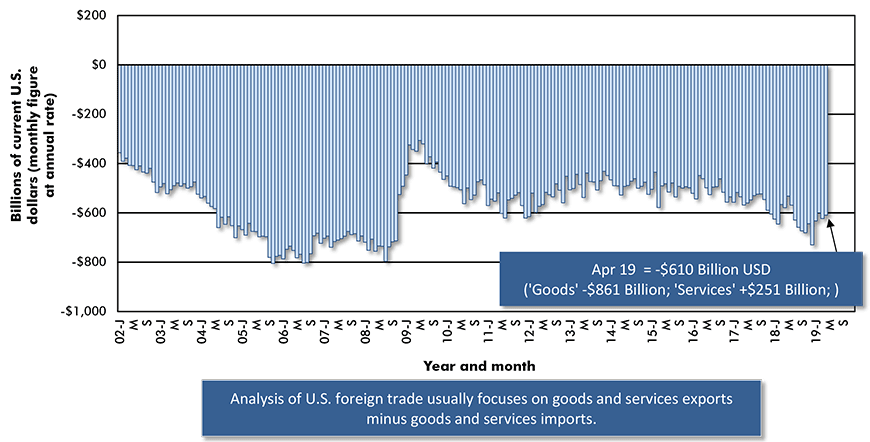
The last data point is for April 2019.
Based on seasonally adjusted monthly figures, projected at an annual rate.
Data source: Bureau of Economic Analysis (BEA).
Chart: ConstructConnect.
Graph 2: Geographic Sources of Total U.S. Foreign Trade Deficit in Goods − April 2019
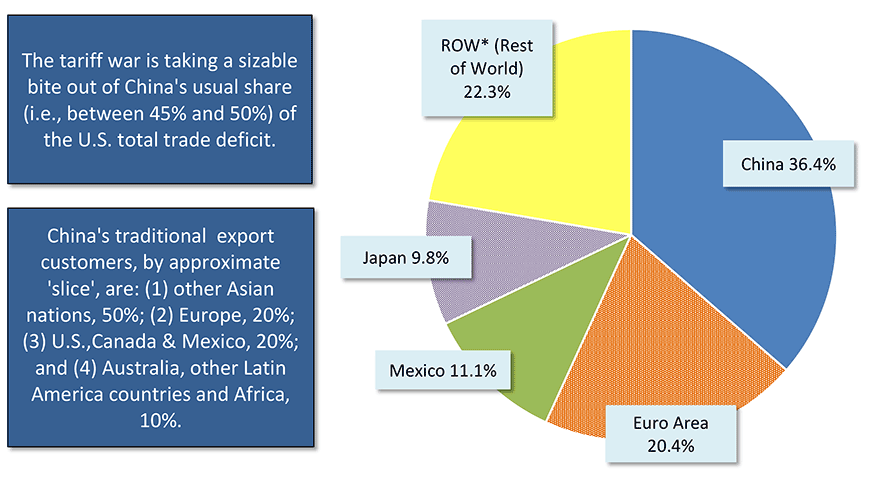
*Major contributors to ROW deficit are South Korea, Taiwan, India and Malaysia.
Data source: U.S. Census Bueau and Bureau of Economic Analysis (BEA).
Chart: ConstructConnect.
Canada’s Goods Trade Deficit Retreats from Record Depth
Canada’s trade deficit in April improved to only -$12 billion, annualized. Four months earlier, in December 2018, it had ballooned to an all-time extreme of -$60 billion.
Still, Canada has a long way to go to return to the days of substantial surpluses that were prevalent before the 2007-2008 recession. Canada used to be able to count on a net export advantage of between +$40 billion CAD and +$60 billion CAD, annualized, each month.
Graph 3 shows the extraordinary inversion, − or expressed more colloquially as the ‘flipping over’, − of Canada’s merchandise (goods) trade performance.
When ‘net exports’ are positive, they add to national output (GDP); when negative, they are a takeaway from GDP’s bottom line.
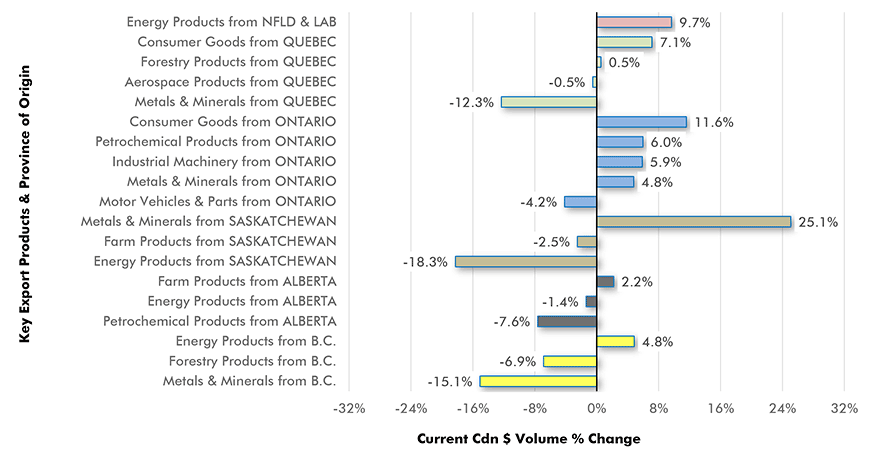
Graph 4 showcases Canada’s key export products and their primary provinces of origin. The three big winners so far this year have been energy product exports from Newfoundland and Labrador, +9.7%; consumer goods exports from Ontario, +11.6%; and metals and minerals from Saskatchewan, +25.1%.
Saskatchewan’s strength in metals and minerals derives mainly from potash and uranium, with potential for extraction of diamonds sprinkled in as well. Mining in other provinces is mainly concentrated in base and precious metals, especially copper, nickel, iron and gold.
Graph 3: Canada’s Foreign Trade: The Merchandise Trade Balance − April 2019
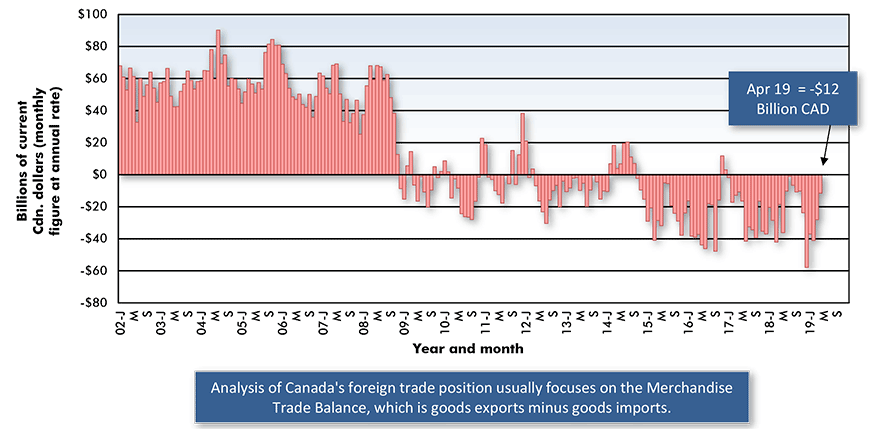
The last data point is for April 2019.
Based on seasonally adjusted monthly figures, projected at an annual rate.
Data source: Statistics Canada.
Chart: ConstructConnect.
Graph 4: Canada’s Key Export Product Sales by Province Ytd −
Jan-Apr 2019 vs Jan-Apr 2018
Data source: Statistics Canada Table 12-10-0119-01.
Chart: ConstructConnect.
Canada’s Proportion of U.S. Oil Imports Achieves 50% Milestone
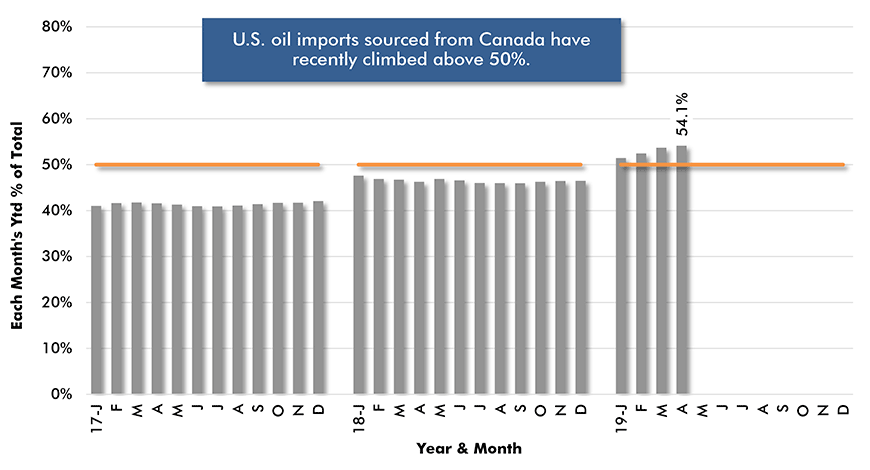
In January of this year, Canada’s share of total U.S. oil imports finally managed a milestone it’s been on the verge of achieving for some time. It crossed above 50%.
Four months into 2019, Canadian ‘barrels’ are now sitting at 54.1% of total U.S. crude imports.
Graph 5 shows the proportion of U.S. oil imports coming from Canada in 2017, 2018 and to date in 2019. The percentages are year-to-date figures for each month. Therefore, it’s easy to see the progression as the year unfolds.
Canada’s share stayed steady, just above 40%, throughout 2017. It jumped to about 48% at the beginning of 2018, then eased back a little as the ensuing months proceeded along. In 2019, it has done nothing but slowly climb, claiming a share that’s more than half in the process.
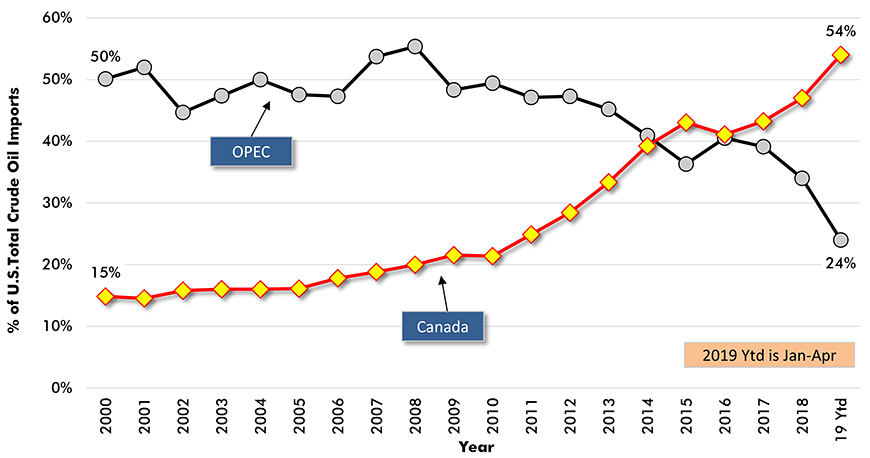
Graph 6 offers an even more stunning rendition of Canadian oil producers’ achievement. In 2000, OPEC nations accounted for 50% of U.S. oil imports. Only 15% was being sourced from Canadian output.
Canada caught up with OPEC in 2014, with both at 40%. Most recently, the tables have been fully turned with Canada at 54% and OPEC, 24%.
Graph 5: U.S. Oil Imports (Barrels) Sourced from Canada −
Each Month’s Year-to-Date % of Total
Data source: U.S. Census Bueau and Bureau of Economic Analysis (BEA).
Chart: ConstructConnect.
Graph 6: Shares of U.S. Total Oil Imports (Barrels)
Sourced from OPEC and Canada
Data sources: Census Bureau, Bureau of Economic Analysis (BEA) & Energy Information Administration (EIA).
Chart: ConstructConnect.
Prospects for Canada’s Oil Patch Appearing a Little Brighter
Canada’s foreign trade position has long rested on success in the oil patch of Alberta, with Newfoundland and Saskatchewan in the game as well. In geopolitics, the escalation in tension between the U.S. and Iran has been driving upwards the global price of oil.
Also, the prospects for delivery system construction have become brighter. President Trump has approved, for a second time, TransCanada’s Keystone XL pipeline expansion. And the Trudeau Liberal government in Ottawa has once again given a go-ahead to Kinder Morgan’s Trans Mountain pipeline capacity addition to the West Coast.
Such approvals, however, don’t equate to anything more than the announcer at Indy saying, “Gentlemen, start your engines!” It doesn’t mean the projects will soon be speeding around the oval track. Progress will surely continue to be delayed by court and ‘sit-in’ challenges.


Recent Comments
comments for this post are closed