Recently, there has been an easing of tensions in two key areas impacting the global economy. The U.S. and China have reached a first phase agreement towards resolving their trade disputes and the U.K. and E.U. are speaking again with the goal of avoiding a ‘hard’ Brexit. A new negotiated arrangement would alleviate the pain from the U.K withdrawing ‘cold turkey’.

At the same time, though, there are multitudinous geopolitical hot spots around the world. Turkey’s military incursion into northern Syria is of particular concern and potentially most destabilizing. Furthermore, an inquiry into the impeachment of the U.S. President has gained surprising traction. Some polls indicate more than half of Americans support such a measure.
No doubt, these are interesting times. With the foregoing as backdrop, there are the following additional nuggets to be gleaned from the latest public and private sector data releases.
(1) Initial Jobless Claims Return to Bullish
When watching for signs of a slowdown in the U.S. economy, one of the first flashing lights will be a worsening in the weekly ‘initial jobless claims’ number. In the second half of September, it seemed that such an occurrence was underway. For September 21st, the initial jobless claims figure increased to 215,000 from 210,000 the week before. Then on September 28th, it rose further to 220,000. A worrying trend appeared to be underway. But in the latest report, for October 5th, it eased again – which is to say, it improved ‒ to 210,000. When the figure climbs back above 240,000, a level not seen in several years, it will be time to pay more attention.
(2) PMI of ISM Tanks
There are, however, readings on the economy that are not as favorable as they once were. For example, the Purchasing Managers Index (PMI) of the Institute of Supply Management (ISM) retreated to 47.8% in September from 49.1% in August. A PMI below 50% indicates that manufacturing activity is slowing down. Although, as long as it stays above 42.9%, the economy will still be growing. History has shown that a PMI of 47.8% corresponds with ‘real’ (i.e., inflation-adjusted) gross domestic product (GDP) growth of just +1.5% annualized.
(3) Health Sector Now Hiring Fastest
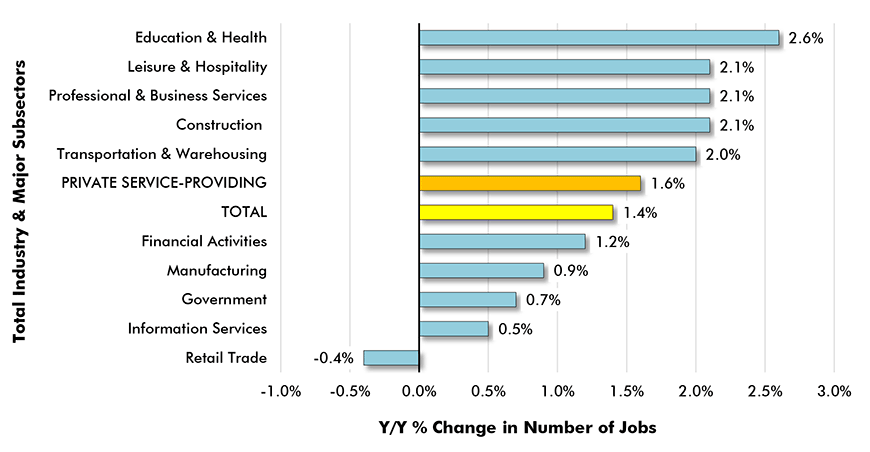
Graph 1 sets out the year-over-year employment changes in key U.S. industrial sectors. ‘Education and health’ is now leading the pack, at +2.6%. Health care has been the more significant driver of the staffing rise in this joint category than education. By way of comparison, the all-jobs increase is +1.4%. ‘Leisure and hospitality’, ‘professional and business services’ and ‘construction’ are all tied at +2.1%. ‘Manufacturing’ is an anemic +0.9%, but at least it’s not negative like ‘retail’, -0.4%. ‘Government’ is only cautiously adding to payrolls, +0.7%.
Graph 1: Y/Y Jobs Growth, U.S. Total Industry & Major Subsectors −
September 2019 (based on seasonally adjusted payroll data)

(4) U.S. Handily Beating Canada in Manufacturing Jobs Creation
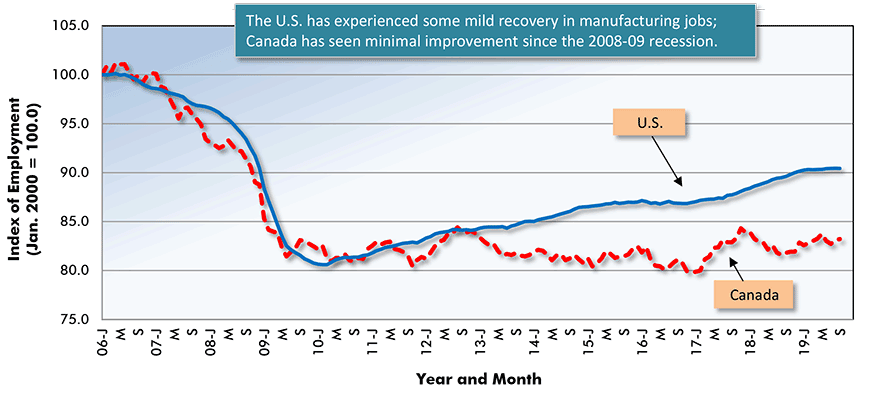
Graph 2, which employs indices, highlights that there has been only a modest pickup in manufacturing jobs in the U.S. economy since the 2008-2009 recession. Nevertheless, America has seen a degree of manufacturing jobs improvement that has surpassed Canada’s. Both curves in Graph 2 set actual jobs levels in January 2006 equal to 100.0. Each subsequent monthly level is expressed as a ratio of January 2006 (e.g., if January 2006 = 4 million jobs and September 2018 = 360,000 jobs, then September 2018’s index value will be 0.90). For both countries, the retreat in manufacturing jobs from 2006 to early 2010 was identical. Since 2010, the U.S. slope has managed a gradual upwards progression. Canada’s slope has revivals followed by reversals.
Graph 2: Manufacturing Jobs, U.S. & Canada – Since Before Recession

(5) U.S. Cities with Lowest and Highest Unemployment Rates
Ten large-population cities in the U.S. currently have unemployment rates that are less than 3.0% not seasonally adjusted (NSA). (The U.S. economy-wide jobless rate is 3.3% NSA). The ten lowest jobless rates in the country are to be found in: Birmingham, Boston and Denver, each with 2.6%; Nashville, San Francisco and San Jose, each with 2.7%; Austin and Salt Lake City, each with 2.8%; and Minneapolis-St. Paul and Richmond, each with 2.9%. At the other end of the spectrum, the eight U.S. metropolitan statistical areas (MSAs) experiencing the highest unemployment rates are: Buffalo, Pittsburg and Riverside, each with 4.4%; Detroit, Las Vegas and New Orleans, each with 4.5%; and Phoenix, 4.7%. Two of the ‘unfortunate’ eight, however, are generating strong jobs growth ‒ Phoenix and Riverside (as discussed in the next section).
(6) Cities with Exemplary Jobs Growth – Orlando No. 1
Phoenix may have a relatively uncomfortable unemployment rate (4.7%), but it is currently tied with Houston for fourth spot among U.S. cities in terms of year-over-year jobs growth, both at +2.7%. (The U.S. economy-wide figure is +1.4%). At the top of the ranking for year-over-year jobs growth are: Orlando, +4.0%; and Dallas-Ft. Worth and Seattle, each with +3.1%. The next-best tier of five cities with rapid jobs growth year over year is comprised of: San Jose, +2.6%; Riverside and Cincinnati, each with +2.5%; San Francisco, +2.4%; and Charlotte, +2.3%.
(7) Canada’s Manufacturing Woes and A Footrace with Construction
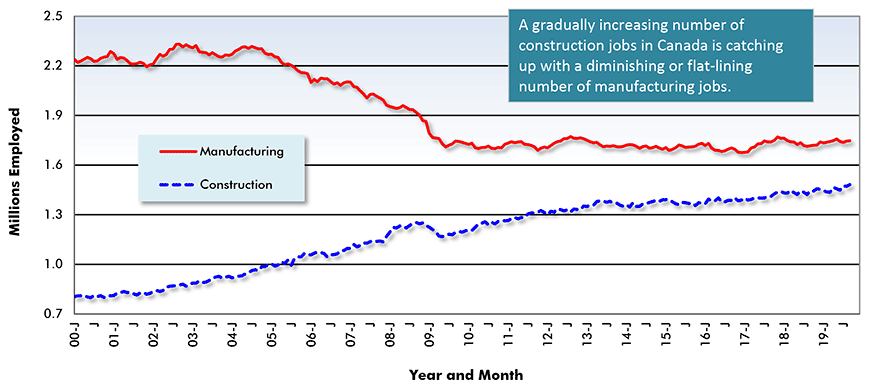
Returning to the woes of manufacturing employment in Canada, ‒ although, it should be added that with the widespread adoption of automation and robotics, the jobs count is no longer a certifiably reliable gauge of activity levels ‒ Graph 3 shines a spotlight on a fascinating phenomenon that is underway in the national jobs market. Employment in construction keeps climbing, although with a flatter slope since 2013 than from 2000 to 2012, while payrolls in manufacturing stand still. The net effect is that the number of jobs in Canadian construction is slowly and possibly inexorably catching up with the number of jobs in manufacturing. A narrowing of the gap is underway in the U.S. as well, but it’s not nearly as apparent.
Graph 3: Manufacturing vs Construction Employment in Canada

(8) Consumer Confidence Dims Slightly
According to the Conference Board, U.S. consumer confidence dimmed to 125.1 in September from 134.2 in August. Given that the base for the index is 1985 equal to 100.0, ‒ since sentiment in 1985 was essentially neutral, running to neither extremes of optimism or pessimism ‒ a reading of 125.1 is still quite upbeat. The ‘expectations index’ concerning labor markets and incomes, however, dropped below 100.0 in September to 95.8. In August, it had been 106.4.
(9) Canadian Housing Starts Keep on Keepin’ On
The ‘standard’ for Canadian housing starts over the past decade has been at least 200,000 units per month annualized. September 2019 (221,000 units) was no exception. Average monthly housing starts in 2019 to date have been 211,000 units, a decline of less than 1.0% from 2018’s comparable figure of 213,000 units. In Canada’s six most populous cities, housing starts year to date (vs. January-September 2018) have been as follows: Vancouver, +23%; Ottawa-Gatineau, +20%; Montreal, +13%; Edmonton, +4%; Calgary, -10%; and Toronto, -20%. In terms of nominal housing starts, and even with a one-fifth year-to-date drop, Toronto still leads all Canadian cities in 2019 with a figure of 21,200 units. Vancouver, at 20,103 units, comes second.
Alex Carrick is Chief Economist for ConstructConnect. He has delivered presentations throughout North America on the U.S., Canadian and world construction outlooks. Mr. Carrick has been with the company since 1985. Links to his numerous articles are featured on Twitter @ConstructConnx, which has 50,000 followers.


Recent Comments
comments for this post are closed