
November’s Starts See Shortage of Mega Projects
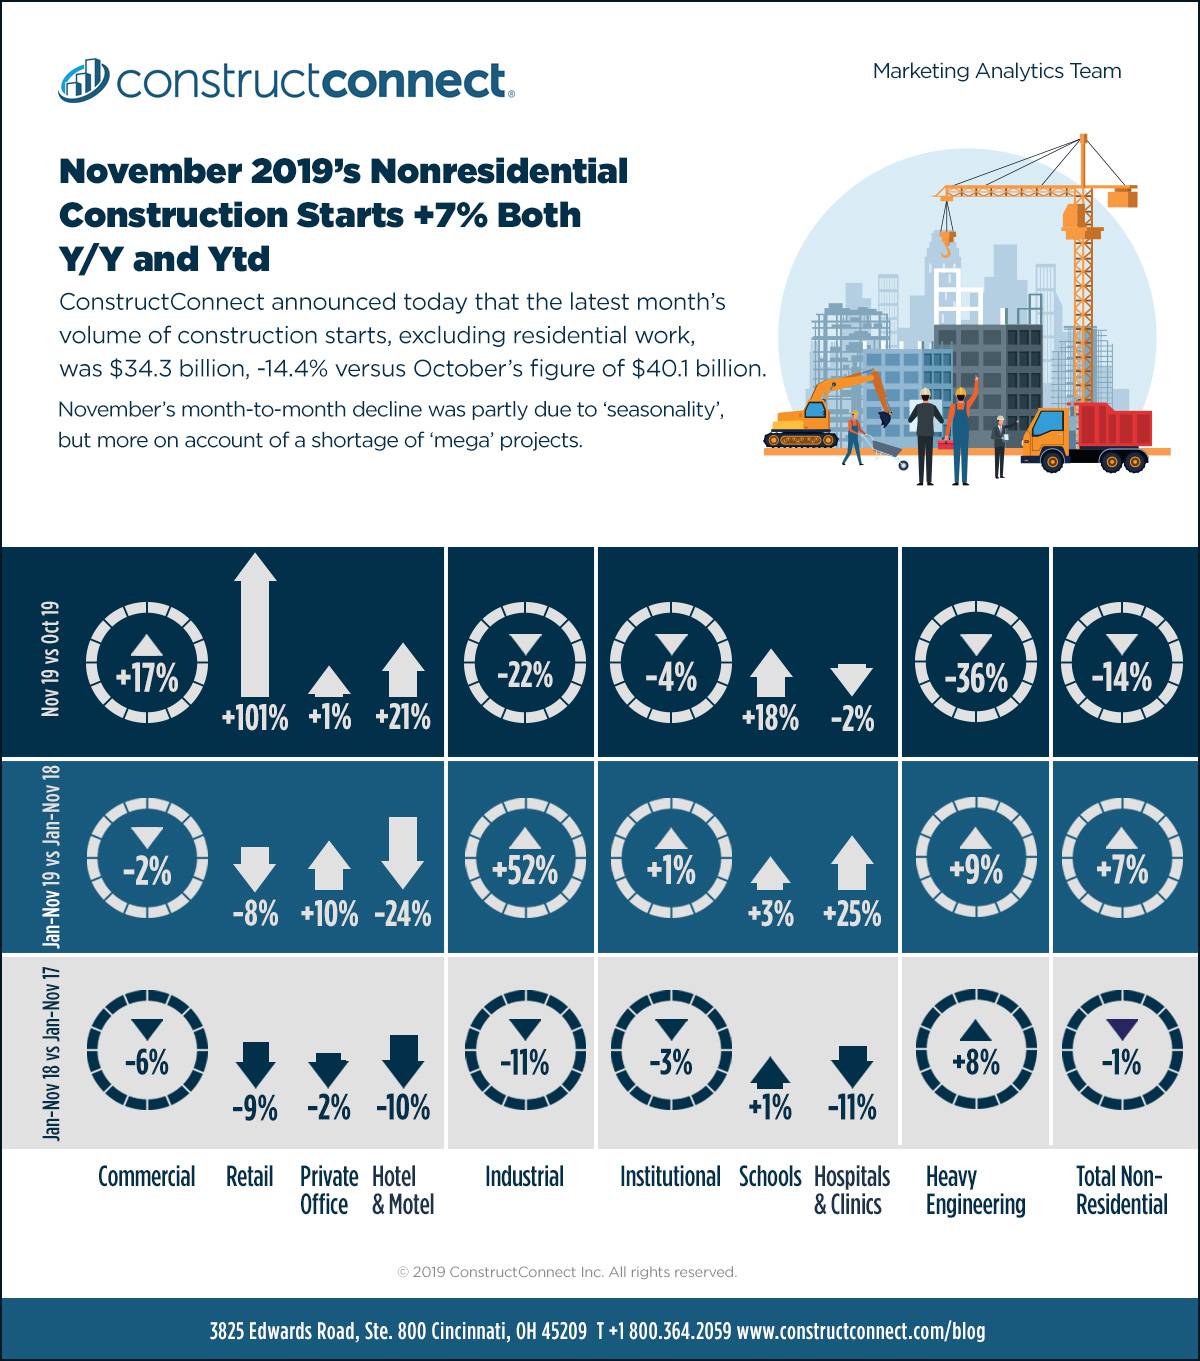
ConstructConnect announced today that the latest month’s volume of construction starts, excluding residential work, was $34.3 billion, -14.4% versus October’s figure of $40.1 billion (originally reported as $38.7 billion).

November’s month-to-month decline was partly due to ‘seasonality’ (i.e., less favorable weather for construction as fall transitions to winter), but more on account of a shortage of ‘mega’ projects of $1 billion or more each. In October, there were three mega project starts with a combined estimated value of $6.1 billion. November’s inventory of such work was only two projects at $1.0 billion each (see Top 10 Project Starts in the U.S. – November 2019). Read the complete November 2019 Industry Snapshot article here: November 2019’s Nonresidential Construction Starts +7% Both Y/Y and Ytd.
November 2019’s total nonresidential start’s level versus November 2018 was ahead by +6.7%. The latest month’s year-to-date performance (i.e., versus January-November 2018) was also upbeat to nearly the exact same degree, +6.8%.
View this information as an infographic.
Construction Overview – Monthly Average Jobs Growth -56%
The U.S. ‘all jobs’ unemployment rates in November were notably tight at 3.5% SA (down from 3.6% in October) and 3.3% NSA (the same as the month before). The construction sector’s jobless rate, however, loosened a little in November to 4.4% NSA. It had been a bit better in October at 4.0%. In November of 2018, it was 3.9%. According to the Bureau of Labor Statistics (BLS), the total number of jobs in construction stayed unchanged in the latest month. 2019’s monthly average pickup in construction jobs has dropped back to +12,000, a decline of more than half (-55%) when compared with 2018’s January-to-November average of +26,000 jobs.
Construction’s year-over-year jobs climb of +2.0% is now tied with ‘professional and business services’ for third spot among industrial sub-sectors, after +2.8% for ‘education and health’ services and +2.5% for ‘leisure and hospitality’. The ‘all jobs’ change has been +1.5%.
November’s annual jobs gains in other corners of the economy with close ties to construction were: ‘oil and gas extraction’, +11.4%; ‘machinery and equipment rental’, +8.3%; ‘real estate activities’, +3.1%; ‘cement and concrete product manufacturing’, +2.8%; ‘architectural and engineering services’, +2.5%; and ‘building material and supplies dealers’, +0.7%.
Click here to download the Construction Industry Snapshot Package – November 2019 PDF.
Click here for the Top 10 Project Starts in the U.S. – November 2019.
Click here for the Nonresidential Construction Starts Trend Graphs – November 2019.
Alex Carrick is Chief Economist for ConstructConnect. He has delivered presentations throughout North America on the U.S., Canadian and world construction outlooks. Mr. Carrick has been with the company since 1985. Links to his numerous articles are featured on Twitter @ConstructConnx, which has 50,000 followers.


Recent Comments
comments for this post are closed