The following are economic ‘nuggets’ gleaned from the latest public and private sector data releases.
(1) Exceptionally Low Unemployment Rates, U.S. and Canada
Rightfully so, a big fuss is being made over how low the current (December 2019) U.S. unemployment rate is, at just 3.5%. The 3.5% level is a seasonally adjusted (SA) figure.
On a not seasonally adjusted (NSA) basis, the U.S. jobless rate is even lower, at a mere 3.4%. What is being overlooked, however, is Canada’s remarkable performance on this front as well.
The Canadian unemployment rate, when it is calculated according to the same methodology as in the U.S., is also miniscule.
At just 4.2%, it’s less than a percentage point above America’s figure. (The name adopted by Statistics Canada for its NSA U.S.-equivalent unemployment rate is ‘R3’.)
Graph 1: U.S. & Canadian Jobs Markets − December, 2019
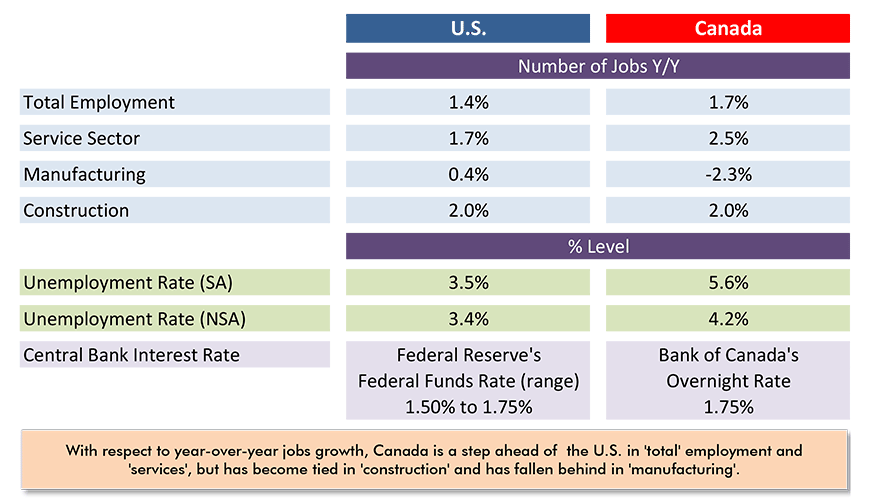
.U.S. labor data is from a ‘payroll survey’ / Canadian labour data is from a ‘household survey’.
Canadian NSA unemployment rate known as ‘R3’ is adjusted to U.S. concepts (i.e., it adopts U.S. equivalent methodology).
(2) Nearly Same Number of ‘Goods’ Jobs as ‘Government’ Jobs
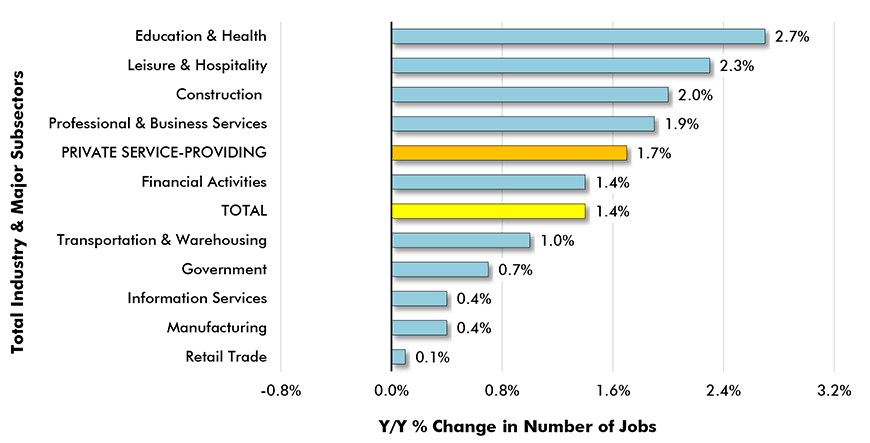
As the numbers are laid out in the latest Employment Situation report from the Bureau of Labor Statistics (BLS), the shares of total nonfarm jobs in December were 14% for ‘goods’ production, 15% for ‘government’ occupations and 71% for private services-providing activities. Their year-over-year changes in employment in the final month of 2019 were as follows: ‘total’, +1.4%; ‘goods’, +0.8%; ‘government’, +0.7%; and ‘services’, +1.7%. Perhaps readers will be surprised to learn that the number of ‘goods-producing’ jobs in the country (21.1 million) is less than the number of ‘government’ jobs (22.6 million). Included among goods-producing jobs are construction (+2.0% year over year) and manufacturing work (+0.4% year over year).
Graph 2: Y/Y Jobs Growth, U.S. Total Industry & Major Subsectors −
December 2019 (based on seasonally adjusted payroll data)
(3) Energy Extraction Jobs Come Roaring Back
While manufacturing and construction provide the bulk of ‘goods-producing’ employment, there is a third category of such work that is currently generating excitement, ‘mining and logging’. Included in ‘mining’ is the ‘oil and gas extraction’ sector. Thanks to hydraulic fracturing, the U.S. has become a world powerhouse in energy production. Chart 3 shows employment in oil and gas extraction sinking into a deep pit in early 2017, but roaring back over the past couple of years. In the latest reporting month (December 2019), the number of jobs in the energy extraction sphere was up by a double-digit percentage change, +13.0%. Further worth noting is that among ConstructConnect’s Top 10 project starts in December were two pipelines, the Permian Highway natural gas pipeline in Texas, for Kinder Morgan Energy Partners, and the crude oil Equality Pipeline in Wyoming for Bridger Pipeline. Each is valued at over $1 billion.
Graph 3: U.S. Employment: Oil and Gas Extraction
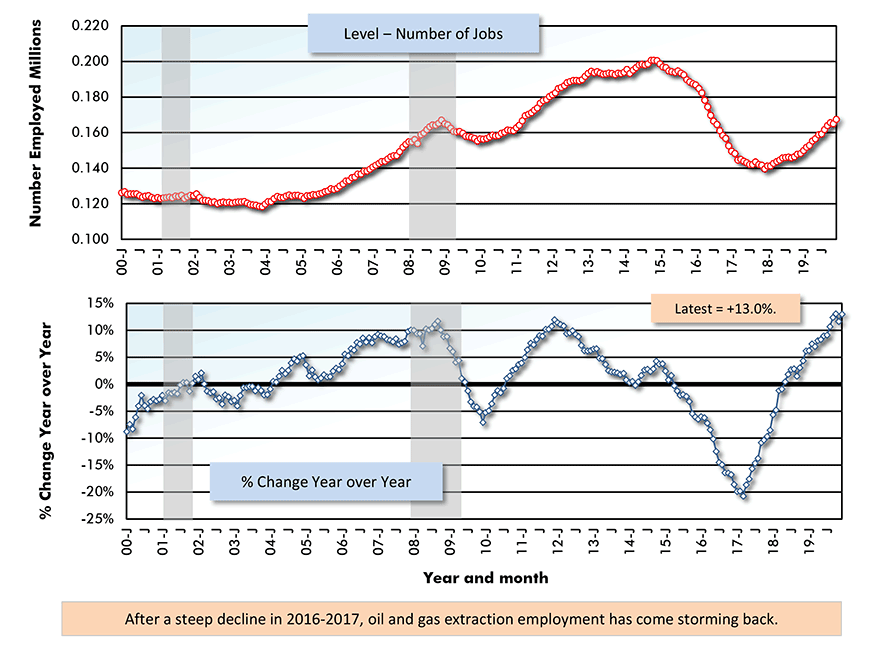
Latest data points are December, 2019 / Based on seasonally adjusted (SA) data.
(4) Salt Lake City (aka ‘Silicon Slopes’) has Nation’s Lowest Unemployment Rate
Among America’s 51 largest cities, by population, the twelve leaders according to tightest unemployment rates are: Salt Lake City, 1.9%; Boston, 2.1%; Birmingham, 2.2%; San Francisco and San Jose tied at 2.3%; Denver and Nashville tied at 2.4%; Austin and Orlando tied at 2.5%; and Atlanta, Jacksonville and Richmond tied at 2.6%. The five urban centers with the worst unemployment rates are: Buffalo and Memphis, tied at 3.9%; Philadelphia, 4.0%; Pittsburgh, 4.3%; and New Orleans, 4.4%.
(5) Raleigh Leading all U.S. Cities in Jobs Growth
As for year-over-year jobs growth, the frontrunners among America’s biggest population centers, at this time, are: Raleigh, +3.8%; Jacksonville, +3.4%; Dallas-Fort Worth and San Antonio tied at +3.2%; Las Vegas and Seattle tied at +2.9%; Orlando and San Jose tied at +2.8%; and Austin and Houston tied at +2.7%. Notice that the foregoing includes all four of the major cities in Texas. It also includes two cities in Florida. Four cities are currently experiencing year-over-year declines in employment: Detroit and Minneapolis-St. Paul, -0.3%; and Hartford and Pittsburgh, -0.4%. (New Orleans, with the country’s highest unemployment rate among major cities, is doing okay with respect to jobs creation, +2.4% y/y.)
(6) ‘Phase One’ Trade Deal with China a Boost to the Economy
The administration in Washington has just signed a ‘Phase One’ trade agreement with China that will reduce some of the huge disparity in the flow of goods between the two nations. Even with restrictive tariffs in place, China is still accounting for most of the overall U.S. trade deficit. China’s proportion of America’s trading shortfall with the world, at 42.5% (Graph 4), is more than three times Mexico’s 13.4% and about five times Japan’s 8.8% and Germany’s 8.5%. U.S. manufacturers and farmers will be pleased with the Phase One pact. It will help stem the erosion of their foreign sales. In November 2019, the year-to-date dollar volume of U.S. export shipments to China was -11.9% compared with the first eleven months of 2018.
Graph 4: Geographic Sources of Total U.S. Foreign Trade Deficit in Goods − November 2019
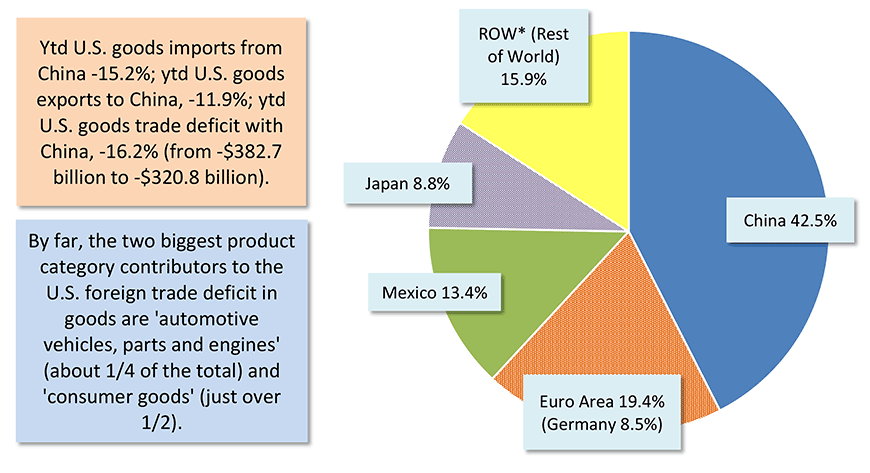
*Major contributors to ROW deficit are South Korea, Taiwan, India and Malaysia.
Data source: U.S. Census Bueau and Bureau of Economic Analysis (BEA).
Chart: ConstructConnect.
(7) U.S. and Canadian Trade Deficits Shrinking
Due to weaker foreign trade, with imports softening more than exports, the U.S. ‘goods and service’s trade deficit has been shrinking of late. At the end of 2018, it was on the edge of ballooning to -$800 billion once again, as it had prior to the 2008-09 recession. But now it has retreated to about -$500 billion. The -$500 billion is made up of -$767 billion in ‘goods’, offset by +$250 billion in services. Foreign trade is a line item in gross domestic product (GDP). Therefore, a smaller negative for trade will usually be a plus for GDP’s total. Except it doesn’t always work that way. A reduction in imports is often a sign of a slowing domestic economy. By the way, Canada’s trade balance (Graph 6) has also been improving and shifting away from what was threatening to be an extreme negative not so long ago.
Graph 5: United States’ Foreign Trade: Goods and Services Balance − November 2019
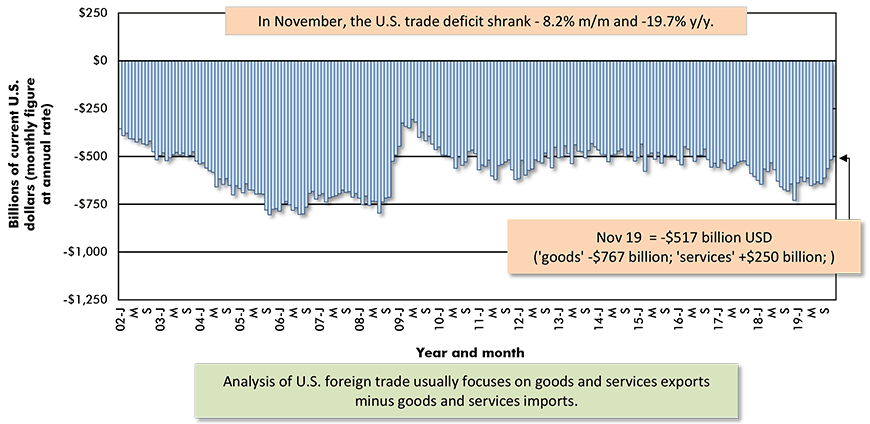
The last data point is for November 2019.
Based on seasonally adjusted monthly figures, projected at an annual rate.
Data source: Bureau of Economic Analysis (BEA).
Chart: ConstructConnect.
Graph 6: Canada’s Foreign Trade: The Merchandise Trade Balance − November 2019
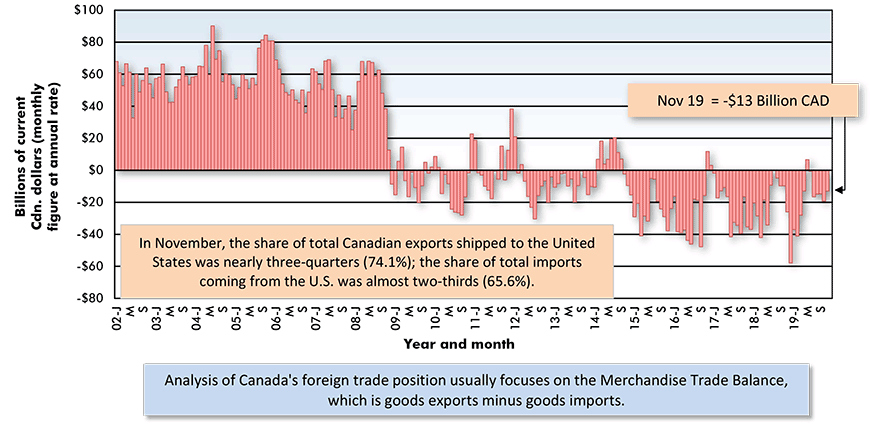
The last data point is for November 2019.
Based on seasonally adjusted monthly figures, projected at an annual rate.
Data source: Statistics Canada.
Chart: ConstructConnect.
Alex Carrick is Chief Economist for ConstructConnect. He has delivered presentations throughout North America on the U.S., Canadian and world construction outlooks. Mr. Carrick has been with the company since 1985. Links to his numerous articles are featured on Twitter @ConstructConnx, which has 50,000 followers.


Recent Comments
comments for this post are closed