
Dallas and Houston Dominant in 2019 Permits
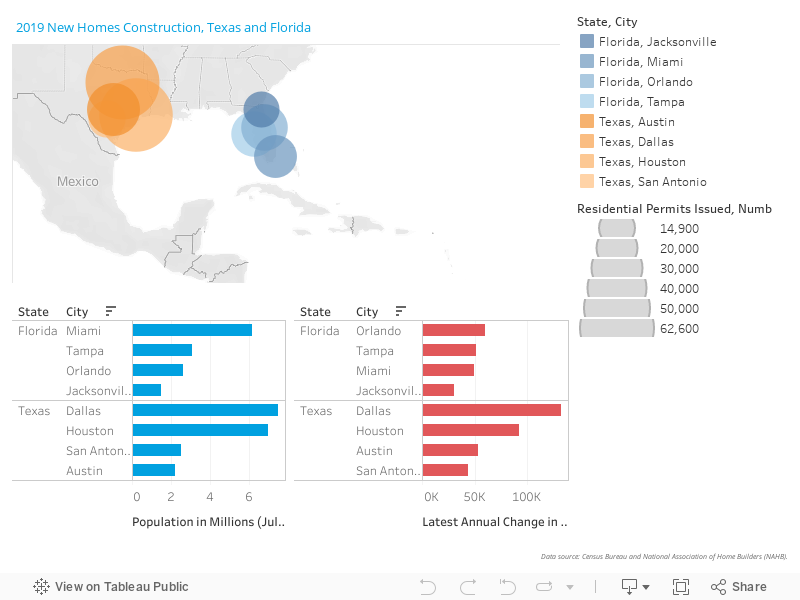
In a ranking of the 50-plus biggest population centers in America, three cities in Texas were among the Top 10 for residential building permits in 2019 ‒ (1) Dallas-Ft. Worth, 62,600 units; (2) Houston, 61,800; and (6) Austin, 32,000.

Florida claimed three spots in the Top 15 ‒ (10) Orlando, 24,800 units; (11) Tampa, 23,600; and (15) Miami, 21,000.
Both Texas and Florida have four major cities. Which ones are missing from the first two paragraphs? From Texas, it’s San Antonio at 15,900 units and from Florida, Jacksonville at 14,900. For San Antonio and Jacksonville, their spots were (19) and (22) respectively.
With respect to their year-over-year percentage changes in number of residential ‘starts’, in units, the leaders among the eight Texas and Florida cites were San Antonio, +49%, and Tampa, +37%.
Two cities registered modest gains, Houston and Austin, each with a figure of +8%. Another two centers were essentially flat, Miami at +1% and Dallas-Ft. Worth, -1%. And the remaining two cities experienced declines: Jacksonville, -4%, and Orlando, -14%.
For cities, the Census Bureau reports on building permits issued, which is not quite the same as a housing ‘starts’ count. Nevertheless, most analysts accept that the ‘permits’ number is close enough to the ‘starts’ figure that the two words can be used interchangeably. The economics phrasing is that ‘permits’ data is a proxy for ‘starts’ statistics. Henceforth, in this article, ‘permits’ will be presented as equivalent to ‘starts’.
Interactive Visual
Graph 1: Dallas-Fort Worth-Arlington Residential Building Permits
Data source: Census Bureau and National Association of Home Builders (NAHB).
Chart: ConstructConnect.
Graph 2: Houston-The Woodlands-Sugar Land Residential Building Permits
Data source: Census Bureau and National Association of Home Builders (NAHB).
Chart: ConstructConnect.
Housing Starts Dance to Population Growth’s Drumbeat
There’s a cyclical nature to housing starts that is driven by movements in mortgage rates, incomes and affordability. But there is also a background drumbeat that propels foundation work on new homes, and it’s an obvious one, population growth.
When a city’s resident count is expanding rapidly, there will be a coincident need for more accommodation space, although perhaps with a bit of a lag.
The U.S.-wide annual climb in population has presently fallen to only +0.5%. The latest city population estimates are for July 1, 2019. On a year-over-year basis, all four cities in Texas had strong population increases in the latest year-over-year period. Best was Austin, at +2.5%, followed by Dallas-Ft. Worth and San Antonio, each at +1.8%. Trailing was Houston, at +1.3%, which was still well above the national average.
Three of the four major cities in Florida also managed exceptional population pick-ups in the latest annual period for which data is available. Orlando has been leading, at +2.4%, with solid second and third place contenders in Jacksonville, +2.0%, and Tampa, +1.7%. Miami, at +0.8%, hasn’t been acquiring new residents to quite the same degree.
It’s well to keep in mind, though, that Miami is, by a considerable margin, Florida’s largest population center. Its 6.2 million resident count doubles second-place Tampa’s 3.1 million.
Graph 3: Austin-San Marcos Residential Building Permits
Data source: Census Bureau and National Association of Home Builders (NAHB).
Chart: ConstructConnect.
Graph 4: San Antonio-New Braunfels Residential Building Permits
Data source: Census Bureau and National Association of Home Builders (NAHB).
Chart: ConstructConnect.
Wow! Population +132,000 Dallas-Ft Worth & +128,000 Toronto
The positive impact on housing starts of a hefty percentage-change in population is one thing. Carrying considerably more weight, though, is a substantial advance in the number of residents (i.e., a sharp rise in the nominal count) of a metro area.
In Texas, from July 1, 2018 to July 1, 2019 and according to Census Bureau estimates, the population of Dallas-Ft. Worth soared by +132,000 individuals. The population of Houston also expanded mightily, by +92,000.
Austin’s resident count rose by +53,000 and San Antonio’s by +44,000.
In Florida, the advances were: +60,000 inhabitants in Orlando; +51,000 in Tampa; +49,000 in Miami; and +30,000 in Jacksonville.
Stating the situation in blunt terms, living space must be found for all the new bodies. Sometimes that means placing more strain on the existing homes marketplace, plus a tightening of rental vacancy rates. Equally often, although maybe playing out over a longer time horizon, it’s a spur to building new residential structures.
Other cities in the U.S. warranting mention for super-large increases in their resident counts in the latest annual data-available period are: Phoenix, +96,000; Atlanta, +76,000; Seattle, +55,000; Riverside, +52,000; Washington D.C., +49,000; Las Vegas, +48,000; and Charlotte, +44,000.
North of the border, and for a one-year more current time frame, from July 1, 2018 to July 1, 2019, Statistics Canada says Toronto’s population shot up by +128,000 people, followed by Montreal at +65,000, then Vancouver, +39,000.
Graph 5: Orlando-Kissimmee-Sanford Residential Building Permits
Data source: Census Bureau and National Association of Home Builders (NAHB).
Chart: ConstructConnect.
Graph 6: Tampa-St. Petersburg-Clearwater Residential Building Permits
Data source: Census Bureau and National Association of Home Builders (NAHB).
Chart: ConstructConnect.
Miami the Outlier in the South for More Multiples than Singles
Seven of the eight major cities in Texas and Florida have not yet succumbed to a phenomenon occurring in many of America’s major urbanized areas. In several locations, ‘multi-unit’ housing starts have acquired a bigger share of total starts than ‘single-family’ structures.
Miami is the outlier. It has caught the new wave.
In 2012, ‘multi-unit’ residential construction in Miami flew past ‘singles’ and it has stayed there ever since. In the most recent year, 2019, the share-of-total for ‘multiples’ in the city was two-thirds (66%) versus only one-third (34%) for ‘singles’.
For the benefit of some readers, the terms ‘singles’ and ‘multiples’ have nothing to do with marriage or partnership status within a home. Rather, they refer to the nature of the structures. Detached homes, likely with accompanying property, are classified as ‘singles’. Towers containing numerous apartments or condos are ‘multiple-unit structures’. A single condo tower may have several hundred ‘multiple units’.
There is one oddity that should be noted. Among townhouse developments, if each unit has its own HVAC system, it is placed by the Census Bureau within the ‘single-family’ home designation. If there is an HVAC system that serves more than one townhouse, such units are catalogued to ‘multiples’. (In Canada, all townhouses are categorized as ‘multi-unit structures’.)
Other cities in the U.S. where ‘multiples’ now comprise the majority of homebuilding activity are Boston, Los Angeles, New York, San Diego, San Francisco and Seattle. In Canada’s six biggest population centers, multiples have moved way ahead of singles everywhere except Edmonton, where there is approximate balance.
In Texas and Florida, the continuing predominance of single-family construction within total residential construction is most apparent in Jacksonville (a 76% share for ‘singles’ to only 24% for ‘multiples’), followed by Houston (64% to 36%), Tampa (62% to 38%) and Orlando (60% to 40%).
In Dallas-Ft. Worth (56% to 44%), Austin (57% to 43%) and San Antonio (also 57% to 43%), the horse race still favors ‘singles’, but ‘multiples’ are only a length or two back.
Graph 7: Miami-Ft Lauderdale-West Palm Beach Residential Building Permits
Data source: Census Bureau and National Association of Home Builders (NAHB).
Chart: ConstructConnect.
Graph 8: Jacksonville Residential Building Permits
Data source: Census Bureau and National Association of Home Builders (NAHB).
Chart: ConstructConnect.
Ripple Effects from Singles vs Multiples
The ‘singles’ versus ‘multiples’ contest is significantly important because it has relevance for other accompanying construction activity.
‘Single-family construction’ can most easily be imagined as extension of the suburbs. Along with a greater distribution of population horizontally, there will be a requirement for infrastructure works such as roads and expressways, as well as sewers and watermains. Additionally, there’ll be a need for primary and secondary schools, shopping malls and smaller commercial plazas, and buildings to house policing and fire protection services.
Multi-unit construction, to the extent it takes place in city cores or near high-tech colleges and campuses, sets in motion a different dynamic for other kinds of construction. There is likely to be more renovation work ‒ e.g., converting vacant warehousing or industrial square footage to be used for schooling or medical clinics or religious establishments.
Also, new vertical spaces, if they do not take advantage of already existing transportation hubs, may inspire city fathers to contemplate expenditures on more comprehensive rapid transit lines.
While the ‘singles’ versus ‘multiples’ mix is significantly determined by demand for housing that considers affordability and other factors such as building height restrictions, there is also a generational component.
Will the wage-earners of younger families have the same tolerance for long commutes that their parents and grandparents had? Perhaps they’ll be spared from having to worry about such a problem by a wider acceptance of working from home.
Alternatively, there is a great deal to like about living in a culturally-rich urbanized environment, a fact being recognized by many persons at the upper end of the age spectrum. Many seniors are selling their homes and downsizing into comfortable and easier-to-maintain apartment or condo buildings.
Alex Carrick is Chief Economist for ConstructConnect. He has delivered presentations throughout North America on the U.S., Canadian and world construction outlooks. Mr. Carrick has been with the company since 1985. Links to his numerous articles are featured on Twitter @ConstructConnx, which has 50,000 followers.


Recent Comments
comments for this post are closed