There are certainly hints that the coronavirus outbreak could be the ‘Black Swan’ that will bring the decade-long period of U.S. economic expansion to an end. Are the statistics being reported out of China accurate? How virulent is the disease? Can it realistically be contained within limited geographic regions?
Suspensions of airline routes, postponements of travel plans and overseas cancellations of high-profile sporting events, as well as an underlying shift in peoples’ appetite for dining out, cruising their local mall or gathering in a public space do not bode well for the next while at least, or until more clarity has been achieved concerning covid-19’s damaging effects.
Nevertheless, the latest weeks have featured a particularly active generation of private sector and government agency data releases concerning the economy. Some of the best ‘nuggets’ are summarized below.
(1) JOLTS Report Failing to Ignite Sparks
The monthly Job Openings and Labor Turnover Survey (JOLTS) conducted by the Bureau of Labor Statistics (BLS) provides insight into whether the U.S. labor market is becoming tighter or looser. Are there more jobs available now, or fewer? And is hiring on an upswing or downswing? Graph 1 shows ‘all job’ openings from JOLTS and it is no longer as upbeat as it once was. Both the level and rate of openings have been in gradual decline over the past year-plus. Important to also point out, though, is that while there has been some relaxation, both the level and rate are still extraordinarily high versus history.
Graph 2 moves on to hiring. ‘All job’ hires as a level and a rate have flattened out since early 2018. Moreover, they have not vastly exceeded their performances from prior to the 2008-09 recession. As for construction work as a subset of ‘all jobs’, opening in the sector, at least as determined in JOLTS, have been easing of late. Hard hat ‘hirings’, on the other hand, have become more sprightly. (The construction JOLTS graphs appear in ConstructConnect’s monthly Industry Snapshot.)
Graph 1: U.S. Total Job Openings (from JOLTS Report)
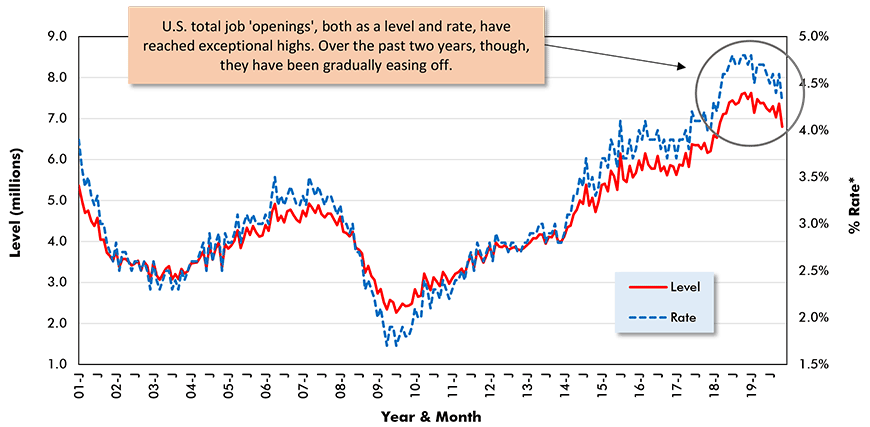
*Rate is number of job openings as % of employment plus number of job openings.
JOLTS − Job Openings and Labor Turnover Survey. Latest seasonally adjusted data points are for Nov. 2019.
Data Source: Bureau of Labor Statistics (BLS).
Chart: ConstructConnect.
Graph 2: U.S. Total Job Hires (from JOLTS Report)
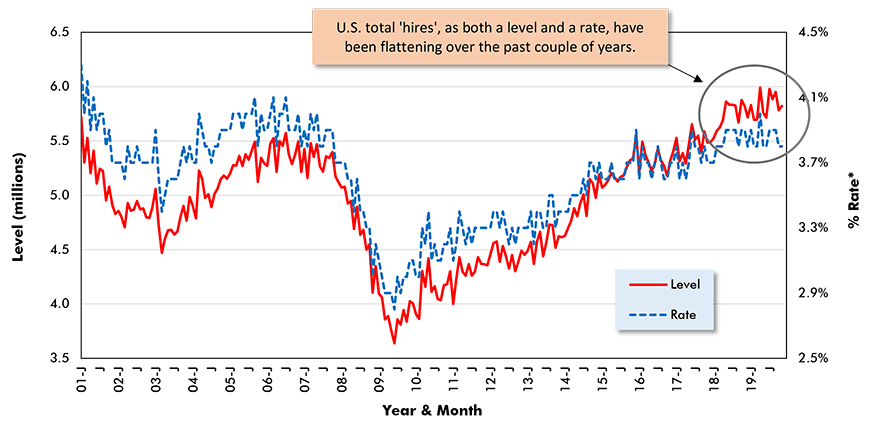
*Rate is number of job openings as % of employment plus number of job openings.
JOLTS − Job Openings and Labor Turnover Survey. Latest seasonally adjusted data points are for Nov. 2019.
Data Source: Bureau of Labor Statistics (BLS).
Chart: ConstructConnect.
(2) U.S. Trade Deficit Shifts from China Elsewhere
After nearly two years of tariff action against several major trading partners, accompanied by retaliatory measures, the U.S. ‘goods and services’ trade balance ended 2019 at -$586 billion annualized, about on a par with where it’s been in most months since 2010. The latest ‘goods’ deficit was -$836 billion annualized. Thankfully, the services balance was +$250 billion. The 45% to 50% share of America’s trade shortfall that usually originates with China was reduced to 37% in the latest month, but the Euro Area’s slice swelled to almost 20%. And Mexico’s portion was a sizable 13%.
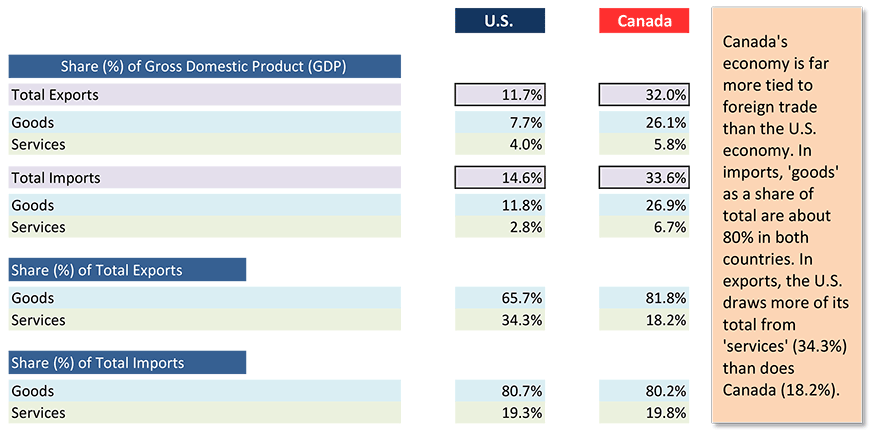
As an interesting sidebar, Table 1 shows the relative importance of foreign trade to the U.S. versus Canada. With respect to outbound ‘traffic’, U.S. exports as a percentage of gross domestic product (GDP), at a rounded 12% in 2019, were only about a third of the comparable figure for Canada, 32.0%. As for inbound products and services, the discrepancy wasn’t quite as large, 15% for the U.S. to 34% for Canada.
(3) Canada Escapes U.S. Oil Import Downdraft
The U.S. imbalance in trade resides mainly in consumer goods and autos. Energy products are no longer a concern. U.S. importations of oil in full year 2019 were -12.1%, recorded in ‘barrels’. Crude oil imports from Saudi Arabia, home to ARAMCO, now the world’s largest publicly-traded company, were -43.3% and from Iraq, -37.5%. Canada, though, has escaped the downdraft. U.S. barrels of crude imported from Canada in 2019 were +6.5% and the Canadian share of total American imports increased to 56% from 47% in 2018. At the start of this century, in the year 2000, Canada’s slice of U.S. oil imports was only 15% to OPEC’s 50%. The tables have been turned.
(4) Canada’s Energy Sector Still Under Cloud of Uncertainty
The sun hasn’t come out to shine on Canada’s energy sector just yet, however. Finally, approvals have been won for construction of both an oil pipeline and a natural gas pipeline to the West Coast, but an attention-grabbing protest against the Coastal Gas Link project along railroad lines in eastern Canada has caused CN Rail to suspend many of its operations. The economy will be taking a hit from the massive disruption in cargo handling and passenger travel. Furthermore, a request for permission to build a new 260,000 barrel per day ‘Frontier’ Oil Sands plant by Teck Resources threatens a confrontation between the supportive Alberta government and the perhaps-less-enthusiastic federal leadership in Ottawa.
Table 1: Relative Importance of Foreign Trade,
U.S. and Canada − 2019
(5) U.S. Unemployment Rate Low, But So Is Canada’s
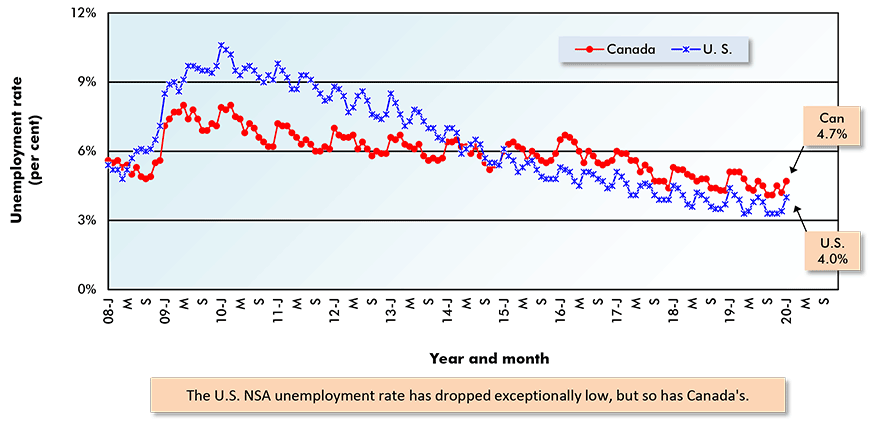
Headlines on the U.S. unemployment rate almost always feature the seasonally adjusted (SA) figure, which in the latest reporting month, was an exceptionally low 3.6%. The ‘poor’ relation is the not seasonally adjusted (NSA) number and in December 2019 it was also historically low, but not quite as eye-popping, at 4.0%. But the NSA figure has a special relevance for Canada. North of the border, Statistics Canada calculates an NSA jobless rate each month entitled R-3 and the methodology adopted is the same as what’s employed south of the border. In other words, there’s a stricter accounting of who is actually out of work and seriously looking to acquire a position. R-3 in Canada in the latest month was only 4.7%, not that far off the American result. Graph 3 shows the close tracking between the U.S. NSA unemployment rate and Canada’s R-3. The Canadian economy, too, warrants commendation for a strong national labor market. (The word ‘national’ is used because there are some provinces, in the Atlantic Region and Alberta, where unemployment remains a problem or has worsened over the past year.)
Graph 3: Canada ‘R-3’ Unemployment Rate Vs U.S. Unemployment Rate
Not Seasonally Adjusted (NSA) Data
(Statistics Canada calculates ‘R-3’ on same basis as U.S. rate)
(6) U.S. Inflation Sent Up Signal Flare in January
U.S. inflation, which has been almost entirely dormant for eight years, sent up a signal flare in January 2020. The all-items Consumer Price Index (CPI-U) was +2.5% year over year. Core inflation, which omits volatile food and energy items, was +2.3% y/y. The +2.5% for ‘all-items’ was the fastest rate of increase since October 2018. There were some months in 2018 when inflation did rear up a bit, climbing to as much as +2.9%, before settling back down again. The sub-categories ‘energy’ (+6.2% y/y) and ‘gasoline’ (+12.8%) were contributors to the latest borderline-unruly behavior of the CPI-U index. An outsized increase in the cost of ‘medical care services’ (+5.1%) also played a role.
(7) The Nonstore Retail Sales Rocket Returns to Earth
The recent year-over-year increase in the price of petrol helped ‘gasoline stations’ realize a +10.4% y/y gain in their receipts in January 2020, according to the latest retail and food services sales report from the Census Bureau. ‘Motor vehicle and parts dealers’ also pulled off a healthy advance in 2019’s first month, +5.7% y/y. Total retail sales, though, were less than torrid, at +4.0% y/y. (A figure of +5.0% y/y or more is the goal.) ‘Building material and garden equipment suppliers’ rang up fewer sales this January than in the same month a year prior, -1.3%. Nonstore retailers (i.e., sellers over the Internet) dropped just below a double-digit percentage gain, to +9.5% y/y in the latest January, after experiencing a hurrah-inducing leap of close to +20% y/y in the holiday-primed and gift-giving month of December.
(8) Top 10 U.S. Cities for Residential Permits Issued in 2019
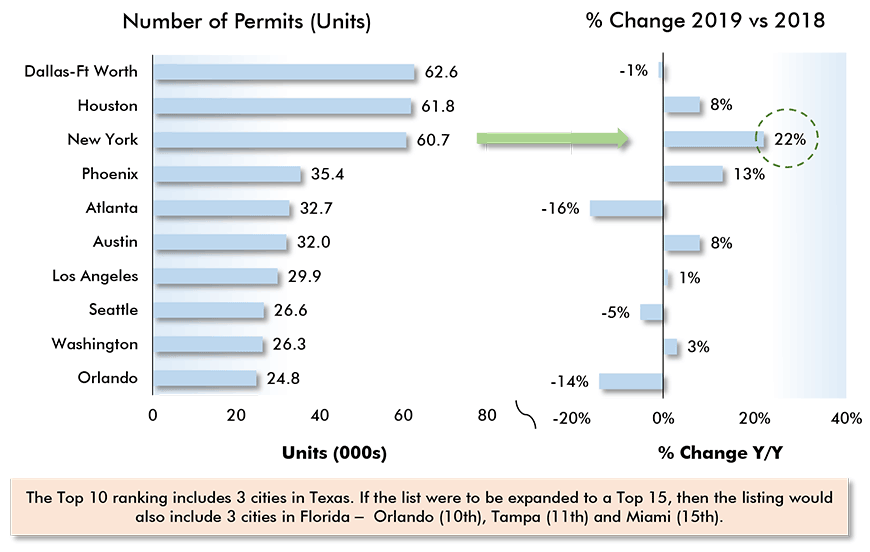
In this monthly Nuggets report, I’ll often record how Canada’s major population centers are performing with respect to housing starts. This time, however, let’s switch things up and look at the leaders among major U.S. cities for total and multi-unit residential structure authorizations. The U.S. figures come from building permits information gathered by the Census Bureau. Residential ‘permits’, though, are generally accepted as a ‘proxy’ for starts. The Top 10 American cities for total residential permits in full year 2019 were: Dallas-Ft. Worth, 62,600 units; Houston, 61,800; New York, 60,700 units; Phoenix, 35,400; Atlanta, 32,700; Austin, 32,000; Los Angeles, 29,900; Seattle, 26,600; Washington D.C., 26,300; and Orlando, 24,800.
Graph 4: Top 10 U.S. Cities for Residential Building Permits in 2019
Data source: Census Bureau & National Association of Home Builders (NAHB).
Chart: ConstructConnect.
(9) N.Y. Head and Shoulders Above All Others in Multi-unit Housing
Notice that the above Top 10 listing for total residential permits includes three cities in Texas. The only Florida city appearing in the ‘best tier’ is Orlando in tenth spot. But if the ranking is expanded to a Top 15, two more cities in Florida pop up, Tampa-St. Petersburg in 11th position (23,600 units) and Miami-Ft. Lauderdale in 15th (21,000). As for which cities led the nation in multi-unit permits last year, there were no surprises. The big-population and advanced urbanization centers won out, with the five at the top being: New York, 49,300 units; Dallas-Ft. Worth, 27, 400; Houston, 21,900; Los Angeles, 20,700; and Seattle, 17,800.
Alex Carrick is Chief Economist for ConstructConnect. He has delivered presentations throughout North America on the U.S., Canadian and world construction outlooks. Mr. Carrick has been with the company since 1985. Links to his numerous articles are featured on Twitter @ConstructConnx, which has 50,000 followers.


Recent Comments
comments for this post are closed