Transocean Delivery Delays and an Oil Price-Slide Effect
At least neither the U.S. nor Canada has entered the coronavirus ‘soft spot’ with a worsening foreign trade picture. For either country, a growing trade deficit would have meant another hard knock beyond the slings and arrows already assaulting gross domestic product (GDP) from coronavirus shocks.
In March, the U.S. goods and services foreign trade deficit shrank by -12.2% m/m. America’s deficit is now positioned at a level (-$479 billion USD annualized) below half a trillion dollars for the first time in three-and-a-half years, dating back to September 2016.
Canada’s merchandise trade deficit (i.e., for ‘goods’ alone) also retreated in the latest month, by more than a third versus February. The Canadian shortfall in March was a small -$12 billion CAD annualized.
In both countries, dollar volume imports of factory goods from China were down in March due to a lag effect. Factories in China were closed earlier this year to stop the spread of COVID-19. It was known in North America that those shutdowns would lead to delayed deliveries from across the Pacific, but it’s taken a while for those holdups to fully materialize.
Barrels-of-oil imported into the U.S. were also down in March, and the dollar volume of such imports going forward will soon plunge along with the steep slide in the global price of oil.
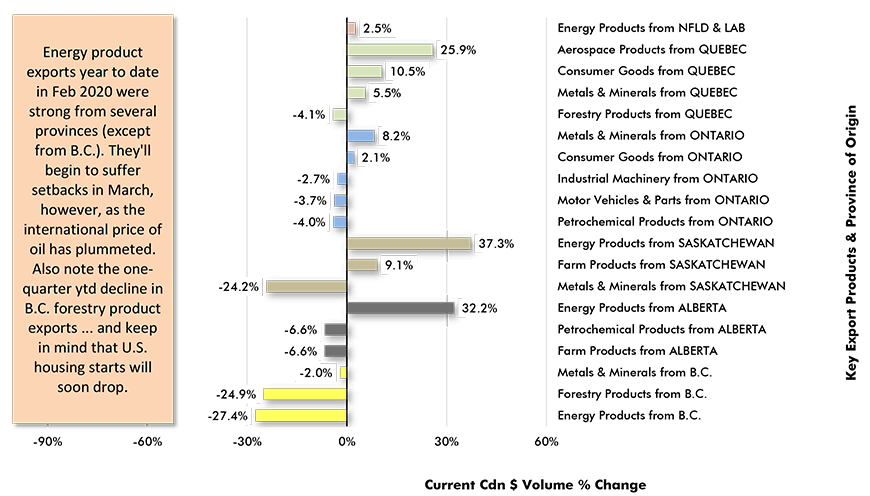
The oil price-slide effect will be positive for America’s trade picture. It will have the opposite impact on Canada’s trade statistics. The gains in the energy export sales achieved by Newfoundland and Labrador, Saskatchewan and Alberta in January-February 2020 (Graph 5) will soon diminish greatly or disappear altogether.
Graph 1: United States’ Foreign Trade: Goods and Services Balance − February 2020
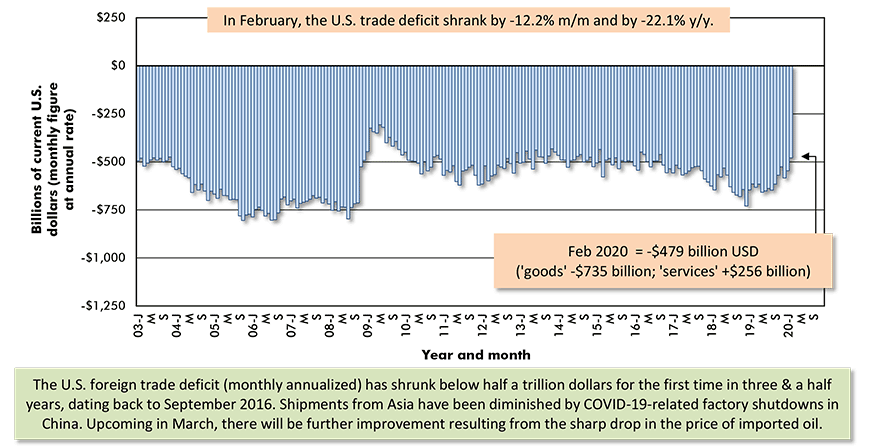
The last data point is for February 2020.
Based on seasonally adjusted monthly figures, projected at an annual rate.
Data source: Bureau of Economic Analysis (BEA).
Chart: ConstructConnect.
Graph 2: Canada’s Foreign Trade: The Merchandise Trade Balance − February 2020
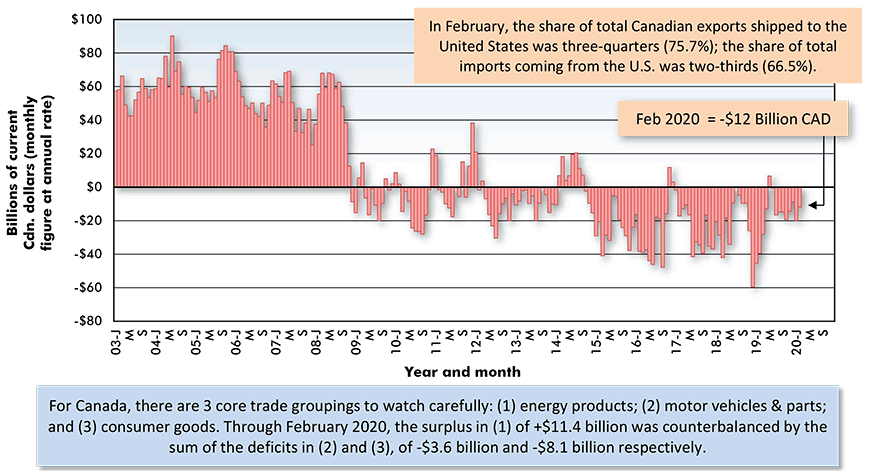
The last data point is for February 2020.
Based on seasonally adjusted monthly figures, projected at an annual rate.
Data source: Statistics Canada.
Chart: ConstructConnect.
An Out-of-Synch Recovery Morass
The foregoing is an interesting preface to what may be a much bigger story as the current difficult times ease up, hopefully, by fall.
By late in 2020, there’s the chance that massive amounts of government stimulus money will kick-start a modest-to-vigorous recovery.
At that time, though, the North American pickup will be out-of-synch with the earlier Chinese, South Korean and other Asian nation re-launches. It’s easy to imagine how this might cause migraines with respect to U.S. and Canadian trade balances.
Unfortunately, within the U.S. and Canadian economies, there are going to be numerous corporate bankruptcies over the next several months. Many formerly reliable home-grown suppliers will be leaving the game.
Long-term, the international supply chain interruptions caused by the coronavirus pandemic will spur on efforts to de-globalize. This was a trend already underway pre-COVID-19.
Looking less far out, however, say between six months and a year, it may become the case that diminished capacity available from domestic suppliers may necessitate turning to already-up-and-running-again offshore sources.
Graph 3: Geographic Sources of Total U.S. Foreign Trade Deficit in Goods − February 2020
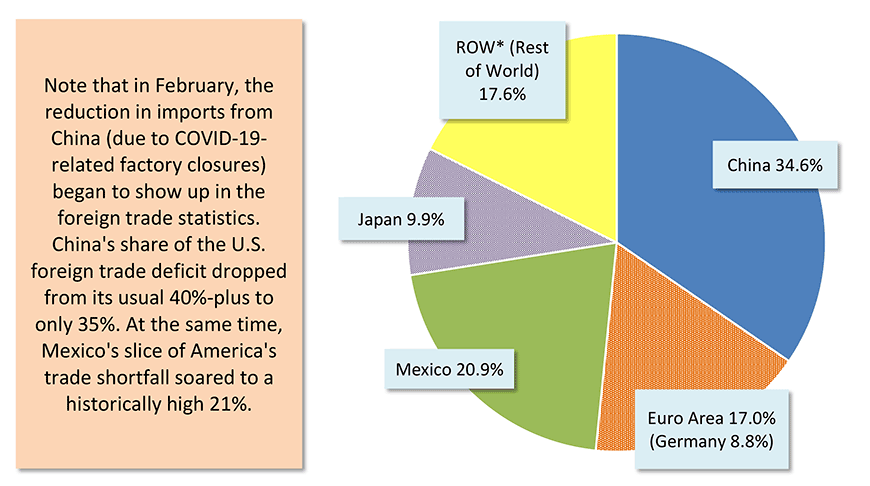
*Major contributors to ROW deficit are South Korea, Taiwan, India and Malaysia.
Data source: U.S. Census Bueau and Bureau of Economic Analysis (BEA).
Chart: ConstructConnect.
Graph 4: Foreign Sources of U.S. Imported Oil
% of Total Barrels Year to Date − February 2020 Year to Date
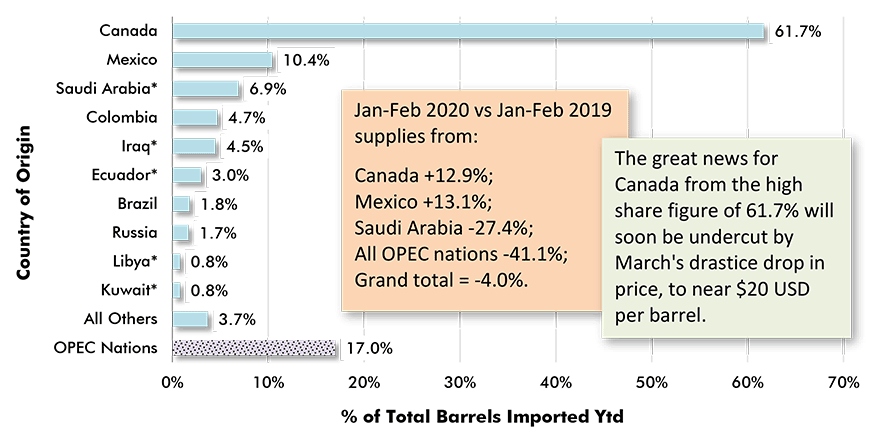
* Asterisk indicates the country is an OPEC member.
Data source: Census Bureau & Bureau of Economic Analysis (BEA).
Chart: ConstructConnect.
Graph 5: Canada’s Key Export Product Sales by Province Ytd −
Jan-Feb 2020 vs Jan-Feb 2019
Data source: Statistics Canada Table 12-10-0119-01.
Chart: ConstructConnect.
Alex Carrick is Chief Economist for ConstructConnect. He has delivered presentations throughout North America on the U.S., Canadian and world construction outlooks. Mr. Carrick has been with the company since 1985. Links to his numerous articles are featured on Twitter @ConstructConnx, which has 50,000 followers.


Recent Comments
comments for this post are closed