Earlier, there was a reporting lag of a month or two, but the latest public and private sector data releases are now capturing the deep malaise that has set in throughout the U.S. and Canadian economies. The sugar coating has worn off and hopes that the devastation would not be as bad as imagined have proven vain. Let’s get on with reporting the latest numbers.

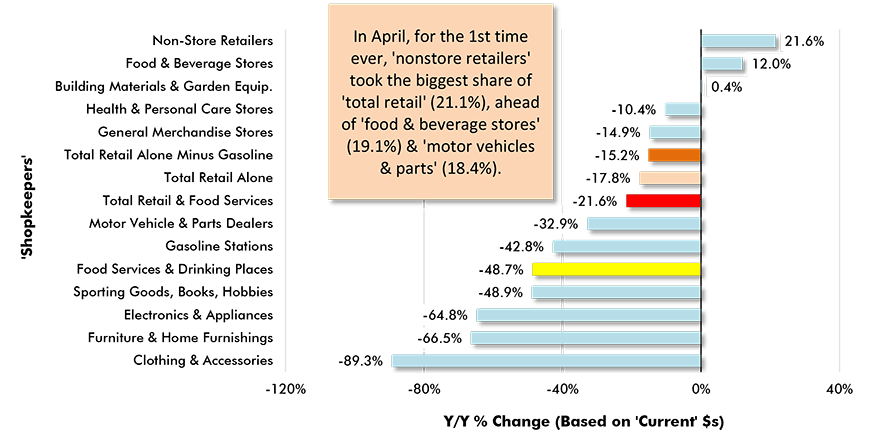
(1) It’s a catalogue of horrors. With many enterprises shut down or open for limited hours, and with consumers nearly everywhere exercising thrift due to actual or threatened layoffs, U.S. retail sales in April were awful. Results for some of the worst hit shopkeeper sub-categories were as follows: ‘clothing and clothing accessories stores’, -89.3% year over year (-78.8% month to month); ‘furniture and home furnishing stores’, -66.5% y/y (-58.7% m/m); ‘electronics and appliance stores’, – 64.8% y/y (-60.6% m/m); and ‘motor vehicle and parts dealers’, -32.9% y/y (-12.4% m/m).
(2) ‘Food services and drinking places’ experienced sales declines of -48.7% y/y and -29.5% m/m. Road traffic has been a mere shadow of its former self, sending ‘gasoline station’ receipts down by -42.8% y/y (-28.8% m/m). ‘Building material and garden equipment suppliers’, though, have been doing okay, +0.4% y/y (-3.5% m/m). And ‘grocery stores’ have been doing just fine, thank you, +13.2% y/y (although -13.2% m/m – a word on that in a minute). Finally, ‘nonstore retailers’, selling over the Internet, have been really cashing in, +21.6% y/y (+8.4% m/m).
(3) ‘Total retail and food services’ sales in April were -21.6% y/y and -16.4% m/m. The -16.4% was the sharpest one-month contraction ever. Furthermore, it came on the heels of a -8.7% drop in March. U.S. ‘retail sales alone’ (i.e., leaving out ‘food services and drinking places’) in the latest month were -17.8% y/y (-15.1% m/m). In March, they had already been heading down, -3.8% y/y and -6.2% m/m.
(4) Before leaving the topic of U.S. retail sales, a couple of other developments warrant mention. First, the -13.1% m/m figure for grocery store sales in April was a follow-up to +26.9% m/m in March. March’s outsized advance was primarily due to stockpiling by shoppers who clearly had thoughts of upcoming lives under quarantine in mind. April’s retreat indicates that hoarding has receded as a priority.
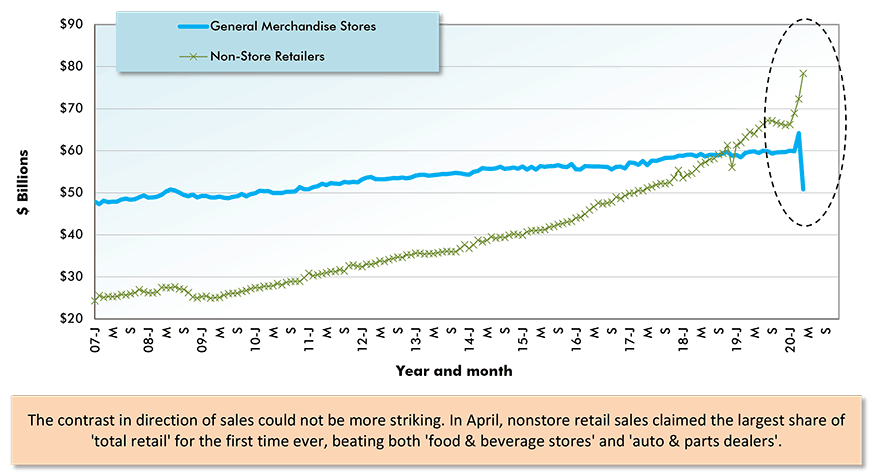
(5) Second, an incredible shift in the composition of U.S. retail sales has just taken place. ‘Motor vehicles and parts’, as a share of ‘total’ (18.9% in April), have moved from first place to third. Second spot in the latest month went to ‘food and beverage’ stores (19.1%). Completing its climb to the top, which has seemed inevitable for a while now, has been the ‘nonstore retailer’ category (21.1%). The three foregoing sub-categories of shop-keeping accounted for nearly 60% of total U.S. retail sales in April.
Graph 1: U.S. Retail & Food Services Sales Y/Y ‒ April, 2020

Chart: ConstructConnect.
Graph 2: U.S. Monthly Sales by General Merchandise Stores vs
Non-Store Retailers (i.e., Internet Platforms & Auctions)

Latest data points are for April, 2020.
Chart: ConstructConnect.
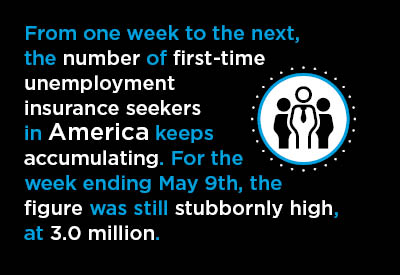
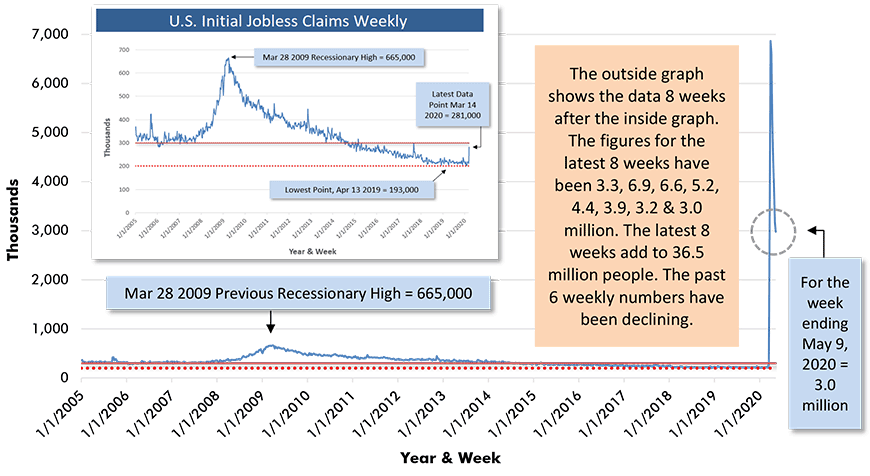
(6) From one week to the next, the number of first-time unemployment insurance seekers in America keeps accumulating. For the week ending May 9th, the figure was still stubbornly high, at 3.0 million. That’s way above the worst figure (670,000) in the 2008-09 recession. The sum of the weekly numbers over the past two months has now risen to 36.5 million. For the past six weeks, however, there has been a gradual and consistent lessening in the count.
(7) Also, through May 9th, not much was happening in the way of individuals returning to work. Some form of economy re-opening is now occurring in nearly every state. Future weekly initial jobless claims numbers will be counterbalance by re-employment figures. But the extent of the re-hiring will be unknown until publication of the monthly Employment Situation report from the Bureau of Labor Statistics (BLS).
Graph 3: U.S. Initial Jobless Claims Weekly

Chart: ConstructConnect.
(8) In April, according to the Federal Reserve, industrial production in the U.S. fell by -11.2% month to month. Output from the manufacturing sector (-13.7%) slid faster than from mining (-6.1%). True to their more stable business models (with a great deal of inflexible homeowner demand built in), utilities saw minimal reduction (-0.9% m/m) in throughput.
(9) The capacity utilization rate of U.S. total industry in the latest month fell to just 64.9% from 73.2% in the previous month. Two periods prior, it had been 76.7%. There was a similar picture for capacity usage in manufacturing. Factory shutdowns in the auto sector and elsewhere (e.g., meat packing) led to a manufacturing capacity utilization rate that was only 61.1% in April, versus 70.8% in March and 75.0% in February. Carmakers have announced plans to have lines up and running again from mid-May on.
(10) Canadian housing starts were an anemic 166,000 units, seasonally adjusted and annualized (SAAR), in April. In the first three months of the year, they had been close to their decade-long level of 200,000 units. One month does not confirm a steep descent. But there are the same reasons, grounded in significant jobs and earnings cuts, to be concerned about the near-term outlook for homebuilding in Canada as in the U.S. Among Canada’s three most populous cities, housing starts (in units) year to date are -35% in Montreal, -34% in Vancouver, but (astonishingly) +13% in Toronto.
Alex Carrick is Chief Economist for ConstructConnect. He has delivered presentations throughout North America on the U.S., Canadian and world construction outlooks. Mr. Carrick has been with the company since 1985. Links to his numerous articles are featured on Twitter @ConstructConnx, which has 50,000 followers.


Recent Comments
comments for this post are closed