
Too much is happening and there’s no time to waste, so let’s jump right into the ‘nuggets’ to be gleaned from the latest public and private sector data releases.

(1) The latest U.S. initial jobless claims figure, for the week ending July 11, was 1.3 million. The number has now been over a million for 17 weeks in a row. The sum for the entire 17 weeks is 51.3 million. That does not mean 51.3 million people are unemployed. Many individuals have been called back to work. But it does mean that over the last four months, over 50 million Americans have suffered the trauma of being laid off, if only temporarily, or they’ve had their hours of employment drastically reduced. How unbelievable is that? Consider this fact: 50 million is approximately one-third of the entire civilian labor force.
(2) By the way, in the Great Recession, the highest level reached by ‘weekly jobless claims’ was 665,000 (for the week ending March 28, 2009), which was only two-thirds of a million. Surpassing a million on a weekly basis once seemed inconceivable. But that was before we all acquired an understanding of the economic wreckage that can be caused by a pandemic. In the same initial jobless claims report published by the Department of Labor, there is a reckoning of individuals who are continuing to draw unemployment insurance. That figure has now retreated to 17.3 million, after reaching a peak of 24.9 million in early May.
(3) In May and June, the U.S. economy recovered 28.6% of all the jobs it lost in March and April. The construction sector in the latest two months has managed to restore more than half (51.6%) of its March-April jobs decline. Staffing in the ‘leisure and hospitality’ industry was the hardest hit among all sectors in early spring. Its employment shrinkage was 7.7 million jobs out of an economy-wide drop of 20.5 million jobs. Restaurants and bars, plus hotels and motels, have lately seen an employment claw-back of 36.9%.
(4) The May-June work-reclaimed ratios in Canada, where 3.0 million jobs ‘went poof’ in March-April due to coronavirus-related work stoppages, are 41.3% for all jobs, 49.7% for construction and 33.4% for ‘accommodation and food services’. In Canada, private sector employment is now -10.4% compared with pre-COVID (i.e., February’s jobs level), but in April it had been much worse, at -18.2%. Public sector employment is currently -4.3% versus February, but it never really fell by much anyway. It was only -5.7% at its worst in April.
(5) In June, the Purchasing Managers’ Index (PMI) of the Institute for Supply Management (ISM) climbed back above 50.0% for the first time since February. (To repeat, across a wide spectrum of data releases, February was the last month untouched by coronavirus-related isolation measures.) February’s ISM reading of 50.1% stepped back to 49.1% in March, then plunged to 41.5% in April. In May, it improved a little to 43.1%, then jumped to 52.6% in June. A level above 50.0% indicates both the economy and the manufacturing sector are in growth mode. Between 42.8% and 50.0%, however, the economy is expanding, but manufacturing isn’t. Below 42.8%, nobody’s having fun, and everyone is hunkering down. Notice that only April’s 41.5% was a truly devastating number.
(6) It’s all very well that the PMI is back in ‘good news’ territory, but according to the Federal Reserve, the capacity utilization rate of manufacturing in June sat at only two-thirds, 66.9%, and that’s not high enough to inspire much in the way of new construction. In February 2020, manufacturing’s usage rate was 75.2%. In June 2019, it had been 75.7%.
(7) Some categories of U.S. ‘retail and food services’ sales demonstrated outstanding bounce in June. On a month-to-month (i.e., versus May) percentage-change basis, the big gainers were ‘clothing and clothing accessories stores’, +105.1%; ‘electronics and appliance stores’, +37.4%; and ‘furniture and home furnishing stores’, +32.5%. Those outsized percentage increases are a testament to how bad business was in May, not a sign that’s it’s roaring today.
Graph 1: U.S. Retail & Food Services Sales Y/Y ‒ June, 2020
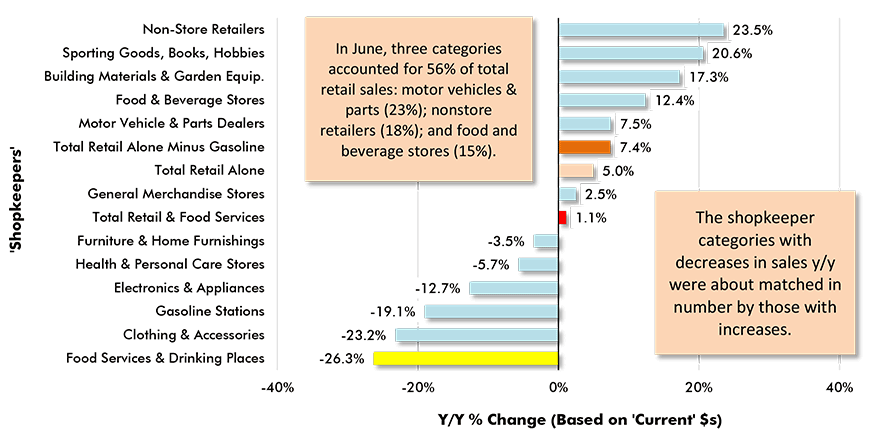
Chart: ConstructConnect.
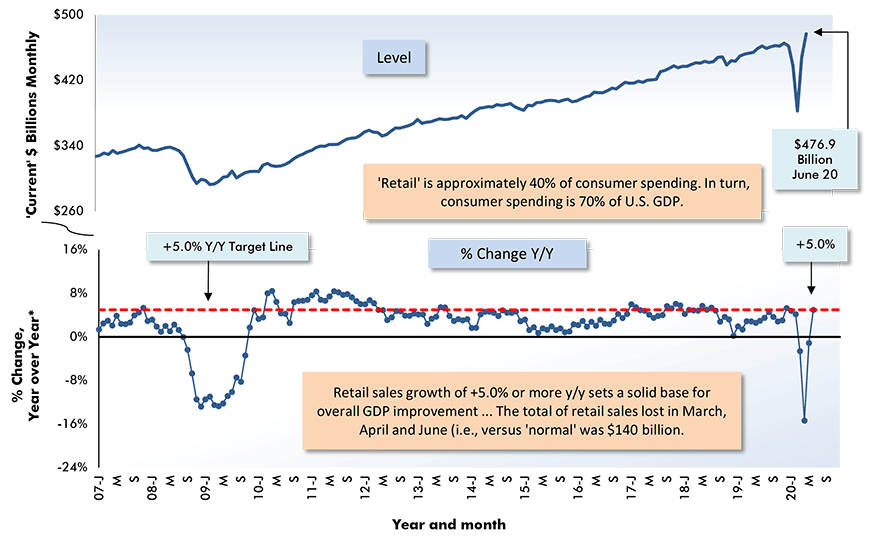
(8) Total ‘retail and food services’ sales in June were +7.5% month to month (m/m) and +1.1% year over year (y/y). ‘Retail’ alone sales were +6.4% m/m and +5.0% y/y. Given the degree of jobs contraction in the economy, +5.0% y/y is pretty good. Revenue at ‘food services and drinking places’ was +20.0% m/m, but still -26.3% y/y. ‘Motor vehicle and parts dealers’ sales came back nicely at +8.2% m/m and +7.5% y/y. ‘Food and beverage store’ sales were -1.2% m/m, but +12.4% y/y. ‘Building material and garden equipment’ sales were -0.3% m/m, but +17.3% y/y. Finally, non-store retailer receipts were -2.4% m/m, but +23.5% y/y. The ‘non-store’ category includes Internet platforms and e-auction houses.
Graph 2: Total Retail Sales in U.S. Monthly
Adjusted for seasonality and trading day differences, but not for price changes (i.e., figures are in ‘current’ dollars).
Chart: ConstructConnect.
(9) Among all the construction materials included in the Bureau of Labor Statistics’ Producer Price Index (PPI) series, the only one stirring up froth presently is softwood lumber, +18.6% year over year and +11.2 since the end of last year. Suppliers of lumber (especially treated lumber) have been surprised by the leap in demand. Holidays are being spent at home these days and that’s inspiring do-it-yourself work on fences, porches and gazebos. Also, restaurants have been quick to set up outdoor patios. Moving in the other direction have been aluminum mill shape prices, -14.5% y/y and -11.3% since December. There has been a surge in demand for canned beverages, that should be propping up aluminum prices. But at the same time, the demand for aluminum to be used in airplane production has taken a tumble.
(10) June’s increase in the PPI’s ‘final demand construction’ series was +2.2% year over year. The ‘inputs to new construction’ PPI series in the latest month was -1.5% y/y. The ‘construction materials special index’ was -0.5%.
(11) According to the Internet home page of Freddie Mac, the average rate charged for a 30-year fixed mortgage loan has, as of July 16, dropped to 2.98%. Less than 3.00% is historically low in records going back 50 years. A 15-year fixed-rate mortgage can, on average, be obtained for 2.48%. The Federal Reserve’s policy-setting interest rate is barely above zero ‒ i.e., it sits in a range of 0.00% to 0.25%. For the Fed to signal an even more aggressive lending stance, it would need to move its rate into unexplored negative territory.
(12) Over the past 10 years ‒ and, indeed, over the past 20 years ‒ the seasonally adjusted and annualized (SAAR) monthly average of housing starts in Canada has been 200,000 units. Due to the huge jobs and earnings displacements that occurred in March and April, it seemed reasonable to expect residential groundbreakings to adjust downwards in dramatic fashion. Hasn’t really happened so far. True enough, April delivered a bleak result, 165,000 units, but that was because the locked-down province of Quebec registered a unit-count of zero. But May, nationally, shot back up to 195,000 units and June came in at 212,000 units. Monthly average Canadian housing starts through the first half of this year have been 199,700 units, a decline of just 2.8% compared with 2019’s H1 figure of 205,500 units.
(13) Housing starts in Canada’s six most populous cities year to date have been: Toronto, +17%; Montreal, -15%; Vancouver, -38%; Calgary, -16%; Edmonton, +7%; and Ottawa-Gatineau, +10% (with the Ontario side at +24% and the province of Quebec side, -18%.) The biggest threat to Canadian housing starts long term would be a slowing in what, until recently, has been rapid population growth. Annual pop growth has been 75% to 80% dependent on immigration, which has been largely curtailed by the world-wide pandemic.
(14) If you’re still holding out hope for a V-shaped recovery, here’s a news story that won’t go down well with breakfast. United Airlines has warned its workers that 36,000 of them may be furloughed in October. Attention everyone! Keep your fingers crossed for a vaccine.
Alex Carrick is Chief Economist for ConstructConnect. He has delivered presentations throughout North America on the U.S., Canadian and world construction outlooks. Mr. Carrick has been with the company since 1985. Links to his numerous articles are featured on Twitter @ConstructConnx, which has 50,000 followers.


Recent Comments
comments for this post are closed