Canada’s Jobs Claw-back Ratio Outperforming America’s
Between February and April, Canada’s total employment contracted by 3.0 million jobs and the seasonally adjusted (SA) unemployment rate soared from 5.6% to 13.0%. The economy, more or less voluntarily, stopped in its tracks and hunkered down at home to slow the advance of the coronavirus contagion.

In May, a first step in jobs recovery was taken with an employment increase of +290,000. In June, according to Statistics Canada, the bounce back was much stronger, at +952,000 jobs.
Also, the nation’s SA unemployment rate has now improved slightly, to 12.3%.
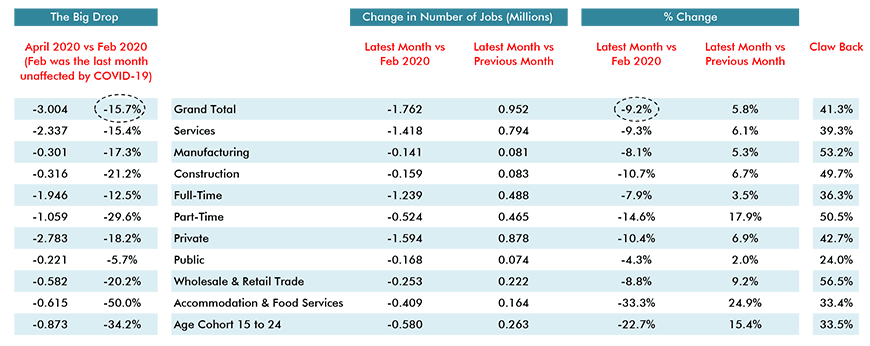
Table 1 sets out the jobs picture for key segments of the Canadian labour market. Table 1 helps answer an important question. How is employment now faring relative to when the ‘Big Drop’ occurred between February and April?
February has been chosen as the base period because it was the last month before COVID-19 started stressing the health care system, seized the headlines and began ravaging statistical data.
Total jobs fell by -3.004 million in nominal terms and by -15.7% in year-over-year percentage terms in the ‘Big Drop’. Presently, two months further along, total jobs are -1.762 numerically and -9.2% year over year, both versus February.
The ‘claw-back’ of total jobs lost in the Big Drop has been 41.3%. The mathematical formula is as follows: 1.0 – (-1.762/-3.004).
Worth noting is that Canada’s current total jobs claw-back ratio of 41% is considerably better than America’s, at 29%.
Table 1: Monitoring the Canadian Employment Recovery ‒ June 2020

Table: ConstructConnect.
Construction Rehires One out of Every Two Laid-off Workers
There are many other fascinating observations to be drawn from Table 1.
Presently, employment in the Canadian private sector is still -10.4% versus its level in February. Public sector employment, though, is down by only -4.3%.
Full-time work is -7.9% compared with February, but that pales next to the deterioration in part-time work, -14.6%. Just the same, there’s good news to report on the part-time employment front. The claw-back ratio for part-time work is 50.5%. A little more than half of the sizable contraction in part-time employment that occurred from February to April has now been reversed.
Two other sectors with outstanding current claw-back ratios are ‘wholesale and retail trade’, 56.5%, and manufacturing, 53.2%. Construction, although not quite making it into the top tier, has been no slouch either, at 49.7%.
Construction has done well, with rehiring that has taken back one out of every two workers who were laid off in early spring. Provincial governments, especially Quebec, were more aggressive in ordering temporary shutdowns of many construction sites (in some cases, whether they might otherwise be judged ‘essential’ or not) than were their counterparts in U.S. states.
Staffing in ‘accommodation and food services’ underwent a devastating rollback in March-April of -50.0%. With a +24.9% pickup month to month in June alone, the sector’s ‘claw-back’ ratio has climbed to one-third (33.4%).
It’s no coincidence that the claw-back ratio for workers aged 15 to 24 is also now approximately one-third (33.5%). Many young adults get their first taste of working life in bars and restaurants.
Alberta & B.C. Labour Markets Struggling
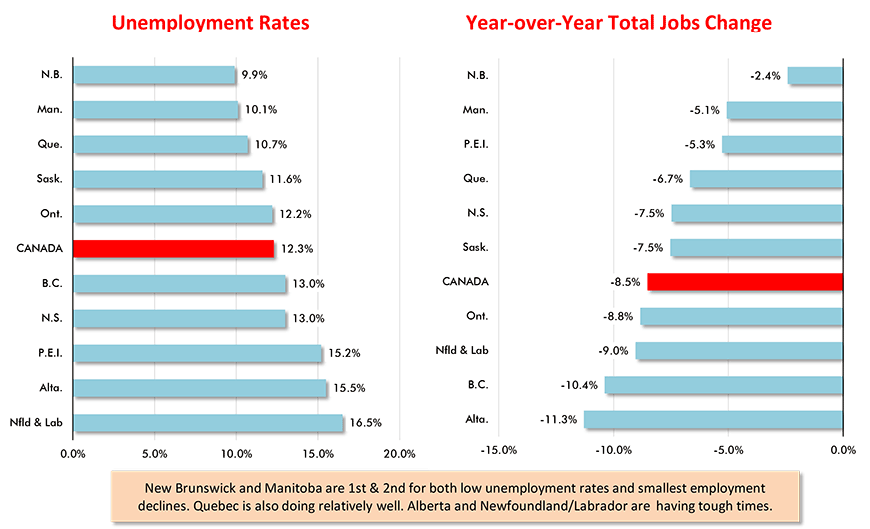
In Graph 1, Canada’s provinces are ranked according to their latest (June 2020) key labour market statistics. The y-axis ordering, reading down, goes from lowest to highest unemployment rates (SA) and from smallest jobs losses, year over year, to biggest. (In ‘normal’ times, the y/y employment comparisons would consist almost entirely of positive percentage changes and the listing would be from fastest to slowest.)
Presently, New Brunswick, Manitoba, Quebec and Saskatchewan all have unemployment rates lower than the national average and year-over-year jobs decreases less than the national decline.
Alberta, British Columbia and Newfoundland/Labrador are the opposite. They have unemployment rates above the Canada-wide number and jobs losses, in percentage-change terms, that are greater than for the nation as a whole.
Graph 1: Canada’s Provincial Labour Markets – June 2020

Chart: ConstructConnect.
Best Claw-back Ratios in N.B. and Quebec; Worst in Alberta & Ontario
Earlier in this article, there was an examination of February to April jobs losses by types of work and the ’15-to-24-year-old’ age cohort. A natural follow-up to Graph 1, however, asks how the provinces fared in the employment department in early spring, ‒ i.e., the period previously referred to as the ‘Big Dip’.
From February to April, there was remarkable uniformity in the number-of-jobs declines recorded by the provinces. The percentage-change drops ranged from a ‘least’ of -12.7% for Saskatchewan to a ‘most’ of -18.7% for Quebec. Remember that Quebec’s government, stung by an alarming number of coronavirus-related deaths in nursing homes, brought in the strictest lockdown measures.
The neighboring and, these days, often bickering provinces of B.C. and Alberta lost jobs to almost the same extent, -15.6% and -15.5% respectively.
Now, however, employment numbers for June are available and it’s fair to wonder how the provinces are doing with respect to reclaiming their former (February) employment levels.
The two provinces with the best records in restoring their February-April jobs losses have been New Brunswick, with a claw-back ratio of 78.6%, and Quebec, 58.3%.
The two provinces with the poorest claw-back records to date have been Alberta, 33.2%, and Ontario, only 28.7%.
Alex Carrick is Chief Economist for ConstructConnect. He has delivered presentations throughout North America on the U.S., Canadian and world construction outlooks. Mr. Carrick has been with the company since 1985. Links to his numerous articles are featured on Twitter @ConstructConnx, which has 50,000 followers.


Recent Comments
comments for this post are closed