
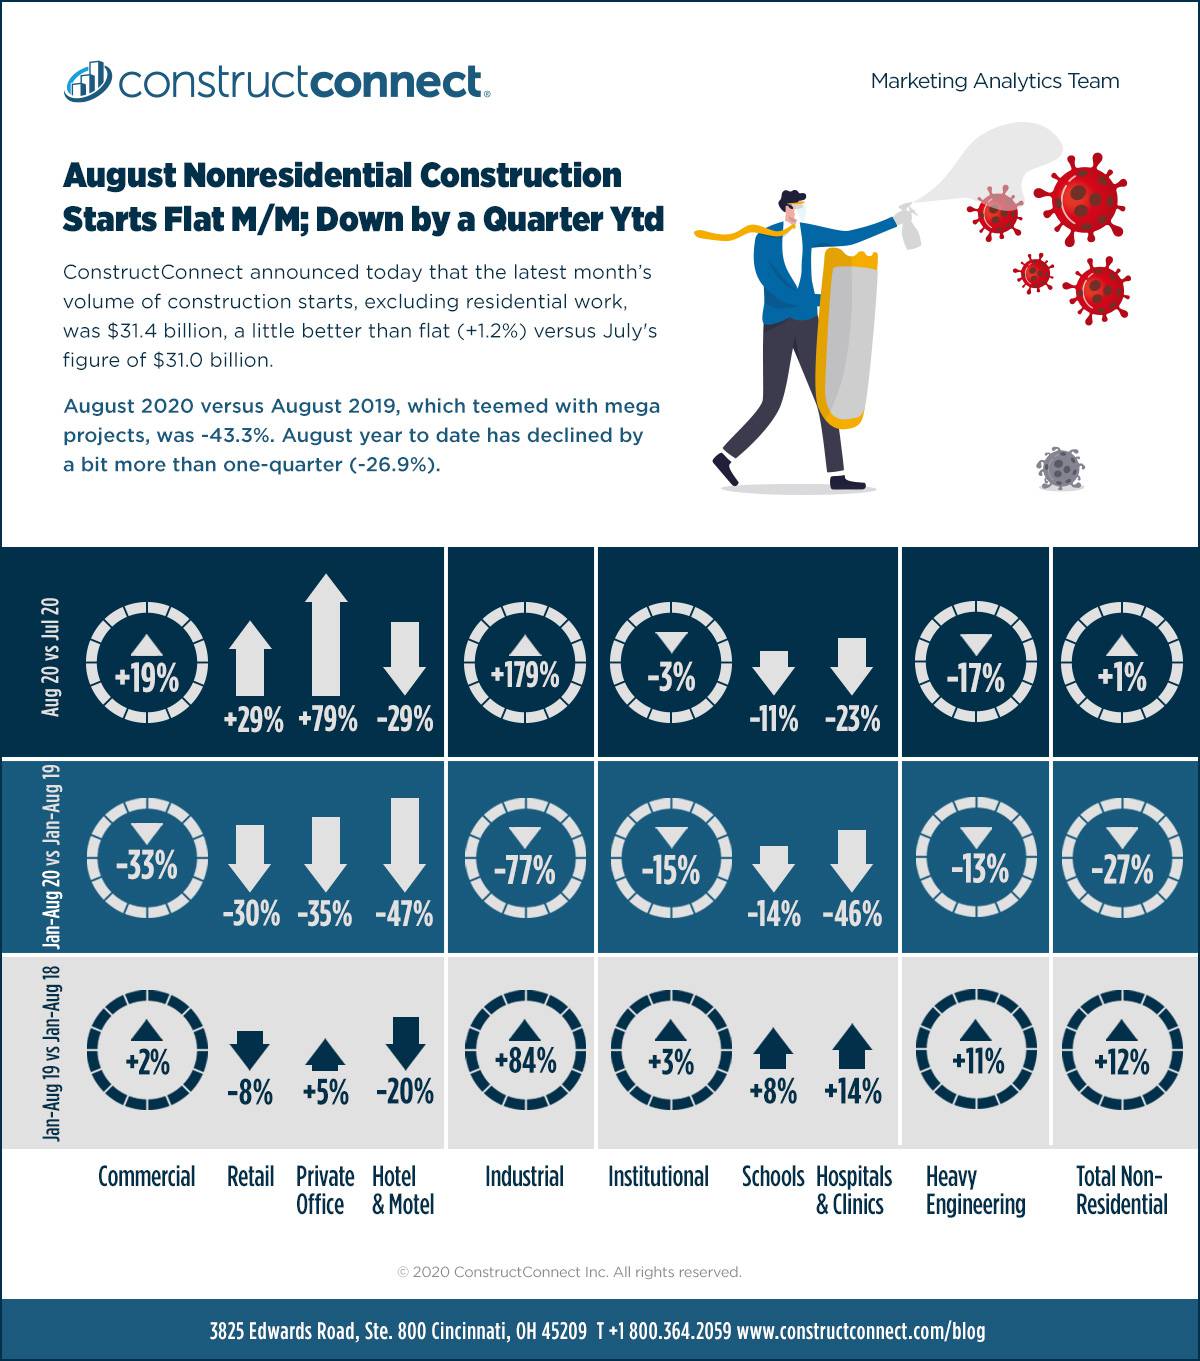
ConstructConnect announced today that the latest month’s volume of construction starts, excluding residential work, was $31.4 billion, a little better than flat (+1.2%) versus July’s figure of $31.0, originally reported as $28.6 billion. The sizable positive revision to the previous month’s number was due to about evenly spread increases in warehouse, bridge, power, and marine work.

Click here to read the complete August 2019 Industry Snapshot article, August Nonresidential Construction Starts Flat M/M; Down by a Quarter YTD – below is a short excerpt.
August 2020 versus August 2019 nonresidential starts were -43.3%. But 2019 was an exceptional year for ‘mega’ project starts (i.e., projects valued at $1 billion or more each). In 2019, there were 35 mega projects summing to $79.1 billion. August 2019 was last year’s best month for mega projects (although it only just beat May), providing five such groundbreakings totaling $18.7 billion. The dollar volume difference between total nonresidential starts in August of this year versus the same month of last year was $24.0 billion. The shortfall of $24.0 billion was almost entirely due to the much stronger mega project profile last year.
Year-to-date total nonresidential starts in the latest month were -26.9% compared with the same January-August period in 2019. The -26.9% change is tracking closely ConstructConnect’s -23.5% latest forecast for the full year. Year-to-date ‘actual’ nonresidential building starts are -34.4%, a little worse than the -29.7% change forecast for the full year. For ‘civil’ work, the actual year-to-date change is -12.9% compared with a -12.4% full-year projection. And the grand total percentage changes are -20.4% for ytd ‘actual’ versus -21.3% for full-year forecast.
View this information as an infographic.
Construction Has Reclaimed 56% of Jobs Lost in Spring
In March-April of this year, as originally reported, total employment in the U.S. fell by 20.5 million jobs, a decline of -13.5%. The rearing up of the coronavirus contagion was, of course, the culprit. Since April, nearly nine million jobs have been reclaimed. Therefore, the jobs recovery-ratio, or the jobs ‘claw-back’ ratio (which has a feistier sound to it) is 43.8%.
While a good first stride has been taken in winning back the employment loss, 43.8% is still less than half the gap. Moreover, a rising proportion of remaining jobs losses are now being described as permanent rather temporary.
The construction sector’s March-April jobs decline, at -12.8%, almost mirrored the total economy (-13.5%). The sector’s jobs count figure in the Spring was -975,000. In the latest four months, construction has reclaimed 550,000 jobs. The jobs claw-back ratio for construction is now 56.4%.
Click here to download the Construction Industry Snapshot Package – August 2020 PDF.
Click here for the Top 10 Project Starts in the U.S. – August 2020.
Click here for the Nonresidential Construction Starts Trend Graphs – August 2020.
Alex Carrick is Chief Economist for ConstructConnect. He has delivered presentations throughout North America on the U.S., Canadian and world construction outlooks. Mr. Carrick has been with the company since 1985. Links to his numerous articles are featured on Twitter @ConstructConnx, which has 50,000 followers.
Interactive Visual
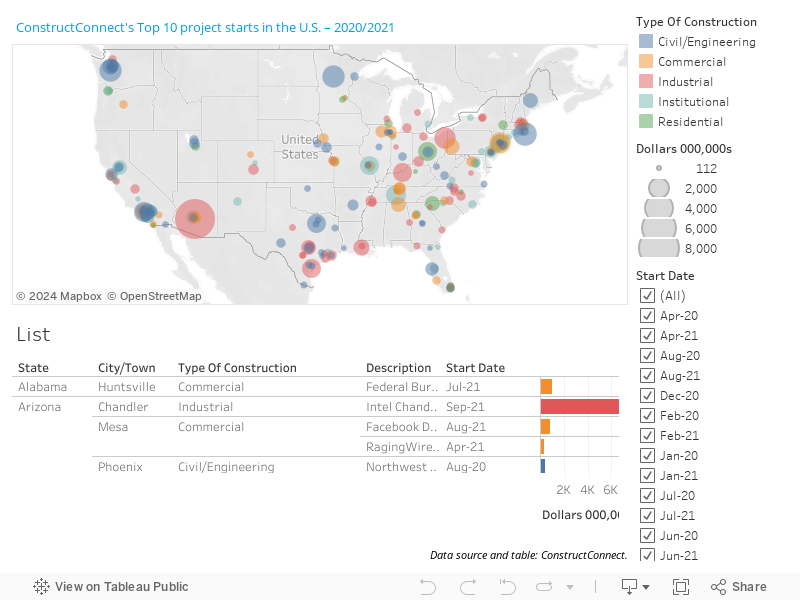
View this video to see how to use the filters in the Interactive Visual.


Recent Comments
comments for this post are closed