
Due to its complexity, much of the subject matter concerning the economy requires detailed editorial commentary, often supported by relevant tables and graphs.
At the same time, though, there are many topics (e.g., relating to demographics, housing starts, etc.) that cry out for compelling ‘short-hand’ visualizations.
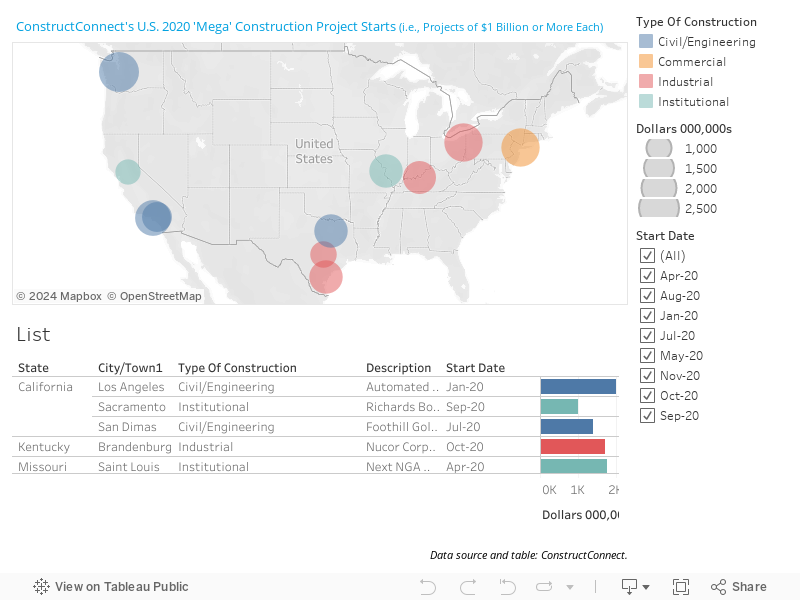
This Interactive Visual looks at U.S. 2020 ‘Mega’ Construction Project Starts (i.e., Projects of $1 Billion or More Each).
Whichever path is followed, the point of the journey, almost always, is to reach a bottom line or two.
To provide additional value, ConstructConnect is pleased to offer an ongoing series of Infographics and Interactive Visuals.
These will help readers sort out the ‘big picture’ more clearly.
Also read the related articles, “35 U.S. Mega Projects Summed to 15% of Total Nonresidential Starts” and “Top 10 Project Starts in the U.S. – September 2020“.
Interactive Visual
View this video to see how to use the filters in the Interactive Visual.


Recent Comments
comments for this post are closed