Mobility Cut in Half
The hope for an economic resurgence once the coronavirus has truly been beaten back, with the help of vaccinations, counts heavily on new housing construction strength. In turn, the need for active home building activity is tied to an expectation that individuals and families will be moving from denser locales to more open spaces.

There are several reasons to project an elevation in people movement: (1) a better appreciation of a suburban or rural lifestyle for raising children; (2) a reduced need for proximity to the office with the wider acceptance of ‘working from home’ (also reducing or eliminating commute times); and (3) escaping from generally more expensive and weather-threatened coastal regions.
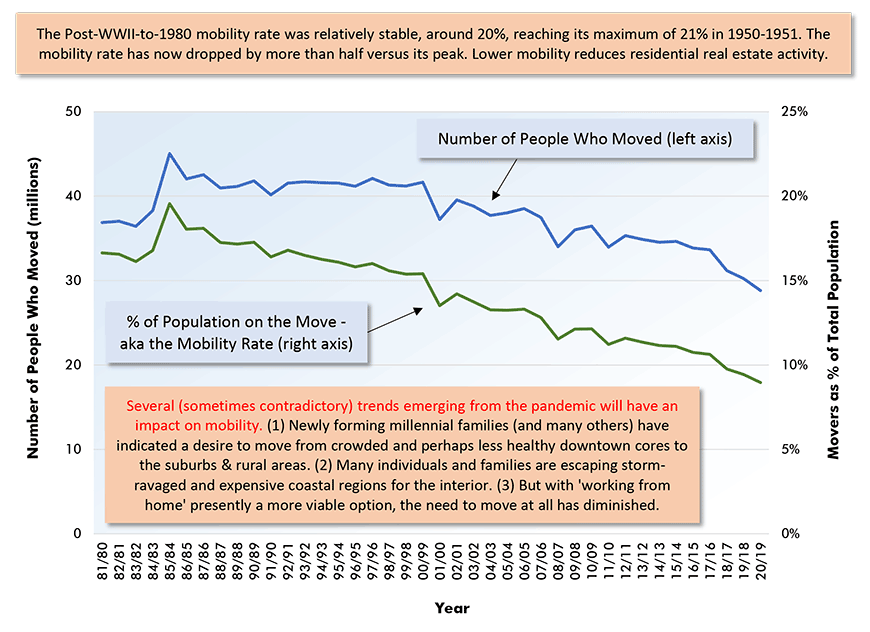
From immediately after the Second World War through the early 1980s, the U.S. mobility rate (i.e., the percentage of the population moving each year) was eye-catching, hovering close to 20%. Over the past three-and-a-half decades, it has gradually eased, to presently sit at 9%.
The mobility level and rate are shown in Graph 1. Through July 1, 2020, an uptick in ‘picking up stakes and moving on’ is not apparent. Statistics through the first half of this year, however, capture only the early days of what will likely be a developing trend.
Early Evidence of Relocation Shifts Underway
There’s certainly evidence from the Census Bureau’s latest population estimates that some significant relocation shifts are underway. Six of the 12 States recording the fastest year-over-year population growth rates on July 1, 2020, are inland from the Pacific Coast states.
The western (‘Mountain’) states with the speediest population advances, along with their national rankings, have been: (1) Idaho, +2.12%; (2) Arizona, +1.78%; (3) Nevada, +1.54%; (4) Utah, +1.45%; (10) Montana, +0.98%; and (12) Colorado, +0.85%.
Among the three western coastal states, Washington has continued to perform well, in eighth spot at +1.05%, but Oregon (17th position) has made only middling headway, +0.60%, and California (42nd) has slipped significantly, -0.18%. (California’s one-year change of -0.18% compares unfavorably with its 10-year annual average figure of +0.55%.)
U.S. national population growth in the latest year ‒ i.e., featuring border closures and greatly reduced immigration, to fight the coronavirus contagion ‒ was just +0.35%, down from +0.65% as an average since 2010.
In the past year (July 1, 2019 to July 1, 2020), 16 states saw their resident counts shrink. Also, many of those 16 are among the most densely populated jurisdictions in the land, including (36th ranked for population change) Massachusetts, -0.02% y/y; (37) Ohio, -0.03%; (38) New Jersey, -0.10%; (41) Pennsylvania, -0.12%; (42) California and Michigan, -0.18% each; (44) Connecticut, -0.25%; (50) Illinois, -0.63%; and (51) New York, -0.65%.
Graph 1: U.S. Residents on the Move (Mobility Level & Rate)

Chart: ConstructConnect.
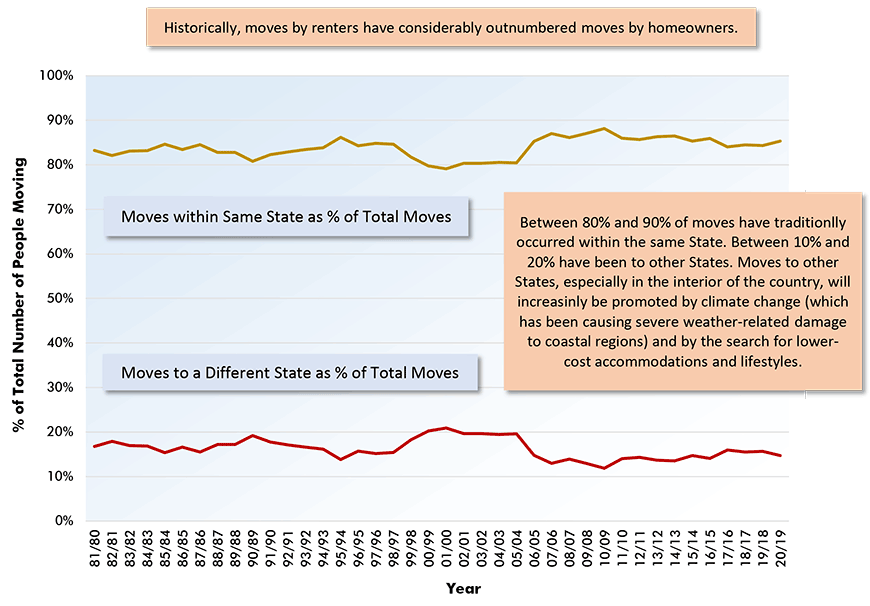
Graph 2: U.S. Residents on the Move (Mobility Level & Rate)

Chart: ConstructConnect.
Winners & Losers in Population Sweepstakes
Not all coastal states have done poorly in the population sweepstakes. In the year to July 1, 2020, Texas managed a population gain of +1.29%; South Carolina, +1.17%; Florida, +1.12%; and North Carolina, +0.95%. Their respective rankings nation-wide among all states were (5), (6), (7) and 11).
As interesting asides, on a 10-year annual average population-growth-rate basis, the District of Columbia has been the frontrunner, +1.78%, while at the rear of the pack have been Illinois, -0.20% and West Virginia, -0.37%. New York’s population has stayed more or less flat, -0.03% as an annual average for the past ten years.
Texas and Florida at Front of Nominal Pop Change; N.Y. at Back
Population percentage changes are interesting, but more significant for construction ‒ i.e., in terms of new roads, residences, fire halls, schools, etc. being needed ‒ are extra levels or additions to actual resident counts.
In the year ending July 1st, 2020, the population of Texas expanded by +374,000; Florida, by +241,000. Those numbers on their own are equivalent to whole new urban areas being plunked down ‘out of the blue’ in a very short time frame.
Other states with big nominal population increases from July 1, 2019 to July 1, 2020 were Arizona, +130,000; North Carolina, +99,000; Georgia, +82,000; and Washington, +80,000.
There are three states where residents have been fast-footing it elsewhere of late ‒ California, -70,000; Illinois, -79,000; and New York, -126,000.
Alex Carrick is Chief Economist for ConstructConnect. He has delivered presentations throughout North America on the U.S., Canadian and world construction outlooks. Mr. Carrick has been with the company since 1985. Links to his numerous articles are featured on Twitter @ConstructConnx, which has 50,000 followers.


Recent Comments
comments for this post are closed