
Due to its complexity, much of the subject matter concerning the economy requires detailed editorial commentary, often supported by relevant tables and graphs.
At the same time, though, there are many topics (e.g., relating to demographics, housing starts, etc.) that cry out for compelling ‘shorthand’ visualizations.
Whichever path is followed, the point of the journey, almost always, is to reach a bottom line or two.
To provide additional value, ConstructConnect is now pleased to offer an ongoing series of 1,000-word charts.
These will help readers sort out the ‘big picture’ more clearly.
These 1,000-word charts look at the best city labour markets in the U.S. (as of January 2021) and Canada (as of February 2021).
Graph 1: Unemployment Rates in U.S. 12 Most Populous Cities
January 2021 – Ranked from #1 Lowest (Best) to #12 Highest (Worst)
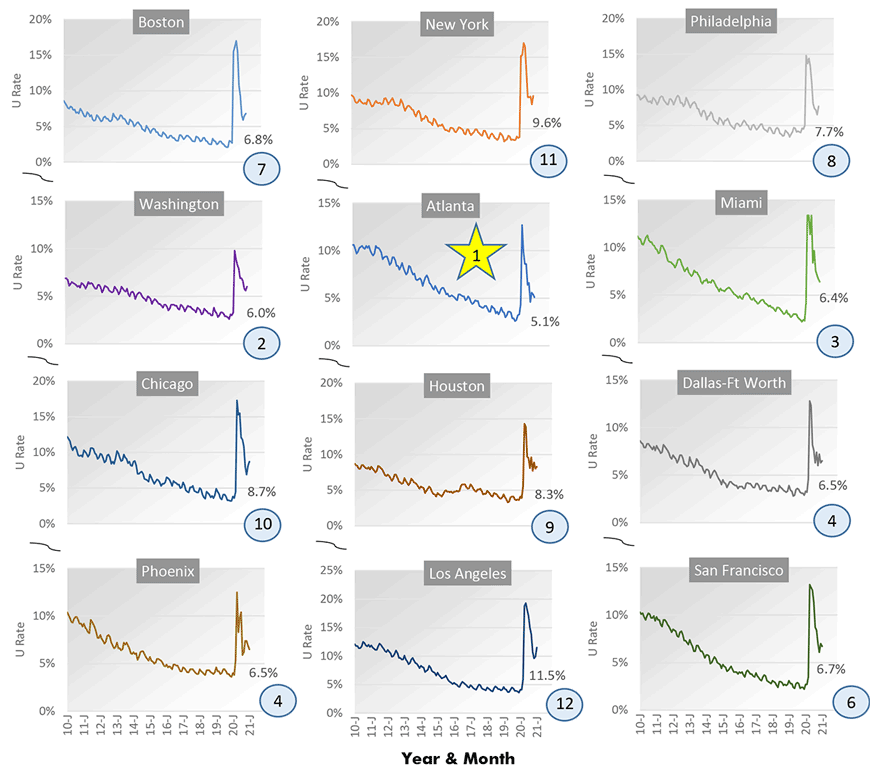
Data source: Bureau of Labor Statistics (BLS).
Charts: ConstructConnect.
Graph 2: Unemployment Rates in Canada’s 6 Most Populous Cities
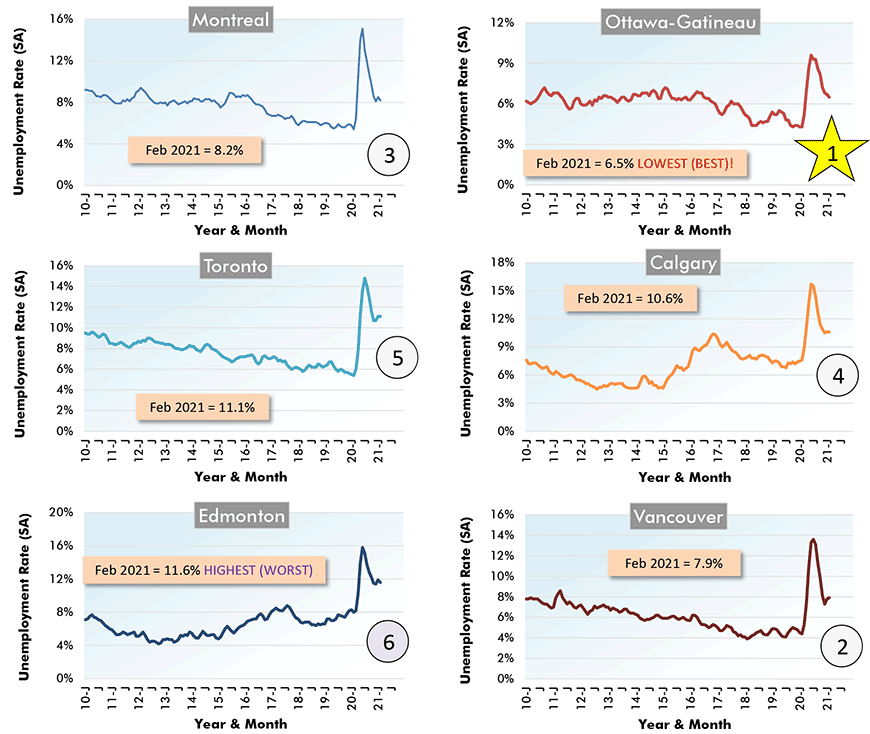
Latest data points are for February, 2021.
Charts: ConstructConnect.
Please click on the following link to view the latest city labour market tables for the U.S. and Canada: CanaData Forecaster Charts & Tables – Employment – Ranking by Major Cities


Recent Comments
comments for this post are closed