
U.S. total employment in February rose by +379,000 jobs, according to the latest labor market report from the Bureau of Labor Statistics (BLS). Prior to the pandemic, a month-to-month jump in jobs of +379,000 would have been greeted with cheers. As Graph 1 shows, however, February’s gain was a rather small blip in the grand scheme of things.

Furthermore, it barely moved the needle with respect to the jobs recovery ratio as set out in Table 1. February’s jobs claw-back ratio (i.e., relative to the huge jobs losses that occurred from February to April of last year, when the coronavirus first struck) improved only slightly, to 53.8% from 52.1% the month prior.
The gap to achieve full employment remains formidable. February’s seasonally adjusted (SA) unemployment rate shrank by a miniscule amount, to 6.2% from 6.3% in January. A year earlier, in February 2020, it had been 3.5%, which brings up an important point.
Graph 1: U.S.: Month-to-month Total Jobs Creation
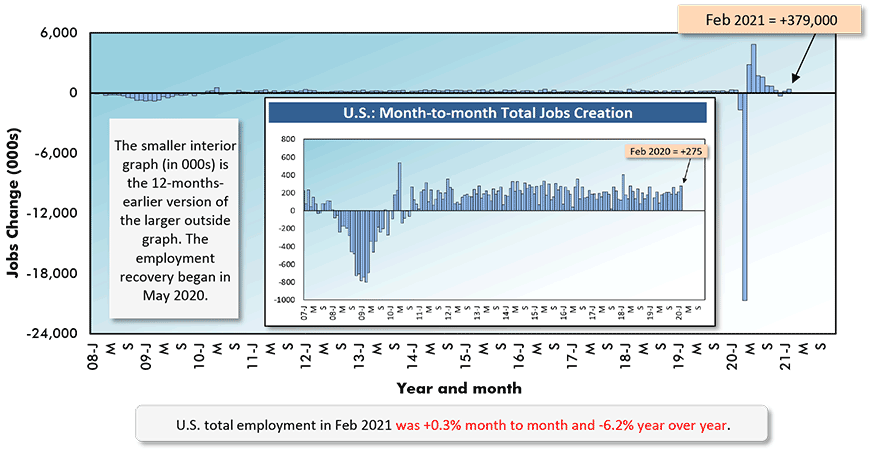
Chart: ConstructConnect.
February 2020 the Last ‘Healthy’ Month
Year versus previous year comparisons will soon need to contend with the dramatic impacts the arrival of COVID-19 imposed on 2020’s numbers, beginning in March. February 2020 was the last ‘healthy’ month with the last set of what might be called ‘normal’ economic statistics. Everyone will be made increasingly aware of this as we move into the Spring.
There are some interesting additional comments to be made concerning the +379,000 jobs performance in February. The figure would have been higher but for the government sector shedding personnel to the tune of -86,000 jobs. State and local governments each accounted for approximately half of the overall drop, with most of the ‘local’ job losses coming in the educational field.
Table 1: Monitoring the U.S. Employment Recovery – February 2021
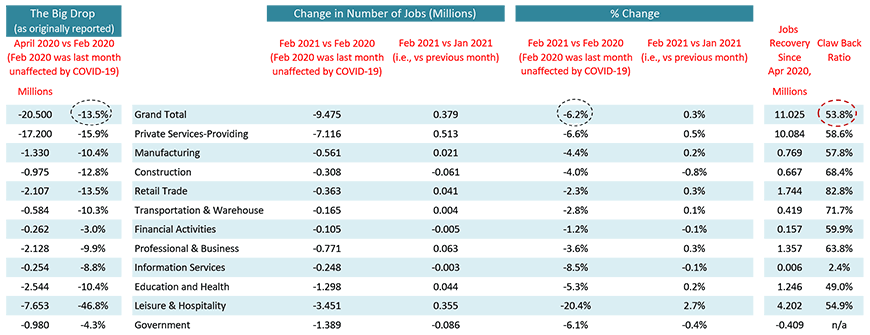
Chart: ConstructConnect.
First Bit of Good News in Leisure & Hospitality Sector
U.S. private services-providing employment in February was ahead month to month by +513,000 jobs, a significantly better number than for all jobs. ‘Services’ benefitted from a +355,000-jobs uplift in the leisure and hospitality sector, providing one of the best bits of news to emerge from that sector in a while.
The not seasonally adjusted (NSA) unemployment rate in the leisure and hospitality sector improved to 13.5% in the latest month from 15.9% one month earlier. And while 13.5% still sounds unpleasantly elevated, consider that in April of last year, the comparable level was a horrendous 39.3%.
By the way, if you’re feeling badly about the recent job losses in the public sector, you should know that the ‘official’ unemployment rate among government workers remains a negligible 2.8%, only a tad worse than in February 2020, when it was 1.6%.
A -61,000-jobs Slide in Construction Employment
The construction sector posted an unfortunate record on the jobs front in the latest month. The number of on-site workers contracted by -61,000. About one-third of the decline was in heavy engineering construction. The other two-thirds occurred at the nonresidential sub-trade level.
Residential construction employment managed to stay on an even keel.
The NSA unemployment rate for all construction workers in the latest February was 9.6%, up from 9.4% in January, and not surprisingly, above February 2020’s figure of 5.5%. (Keep in mind, though, that construction’s unemployment rate in April of last year soared to 16.6%, illustrating how the year over year comparisons will soon be taking on quite a different tonality than we’ve been used to hearing.)
In February versus January, the U.S. construction jobs claw-back ratio took a step backwards, to 68.4% from 74.7%.
Graph 2: Y/Y Jobs Change, U.S. Total Industry & Major Subsectors − February 2021
(based on seasonally adjusted payroll data)
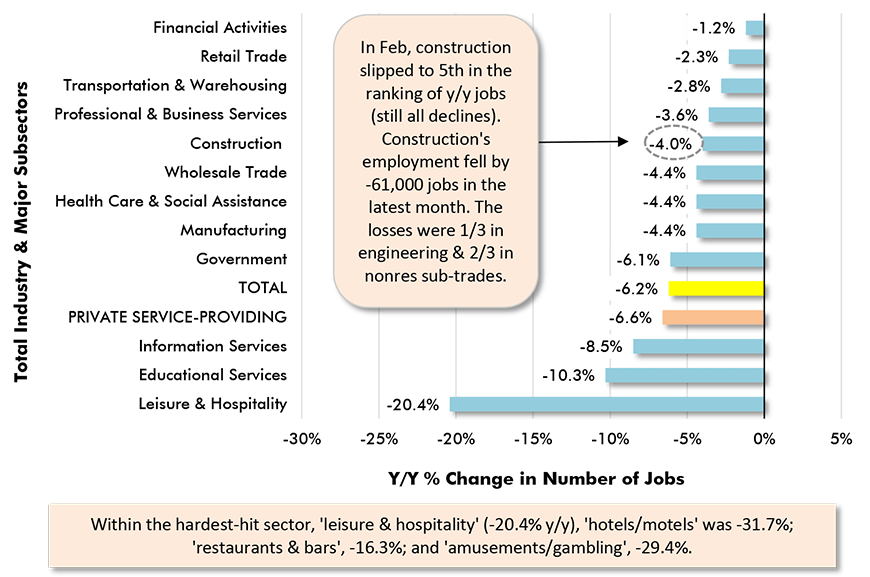
Chart: ConstructConnect.
Moderation in Y/Y Earnings Increases
Year-over-year earnings increases for ‘all jobs’ appear to be moderating. For ‘all jobs’ including supervisory personnel, the y/y climbs in February were +5.3% hourly and +5.9% weekly. Excluding bosses, the leaps were +5.1% hourly and +6.1% weekly.
By comparison, the increases for construction workers were muted, +3.1% hourly and +0.5% weekly including bosses; +2.7% hourly and +0.6% weekly, setting aside bosses.
Two final sidebars: (1) manufacturing employment in the latest month was +21,000 jobs, which was nice to see; but on the other hand, (2) the number of long-term unemployed individuals in the U.S. (i.e., out of work for 27 weeks or more) is now 4.148 million, up from 4.023 million in January. The long-term-unemployed count in February of last year was 1.111 million.
Graph 3: Change in Level of U.S. Construction Employment, Month to Month (M/M) −
Total & by Categories – February, 2021
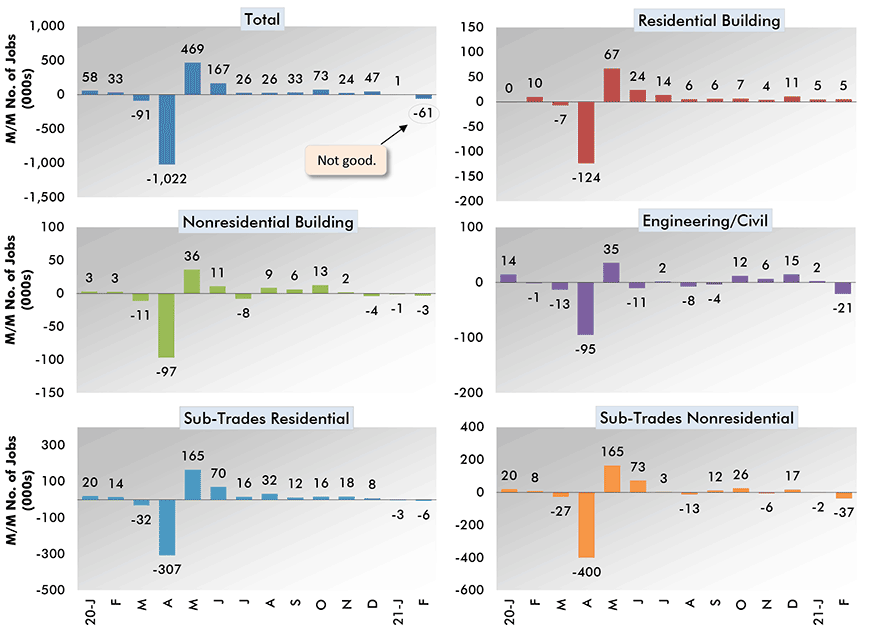
Chart: ConstructConnect.
Please click on the following link to download the PDF version of this article:
Economy at a Glance Vol. 17, Issues 41 and 42 – What’s to Like or Not Like About February’s +379,000 U.S. Jobs Count – PDF
Alex Carrick is Chief Economist for ConstructConnect. He has delivered presentations throughout North America on the U.S., Canadian and world construction outlooks. Mr. Carrick has been with the company since 1985. Links to his numerous articles are featured on Twitter @ConstructConnx, which has 50,000 followers.


Recent Comments
comments for this post are closed