
Canada Benefitting from ‘Lower Base Level’ Effect
The U.S. ‘real’ (after inflation) gross domestic product (GDP) contraction in 2020 versus 2019 was -3.5%. Canada’s comparable figure was -5.4%. The worse performance for Canada was primarily due to the country locking down faster and subsequently staying under tighter restrictions longer than the U.S. to stave off coronavirus infections.

The drops in employment in the U.S. and Canada between February and April of last year were -13.5% and -15.7% respectively. But Canada’s decline was more front-end loaded (i.e., more of it happened between February and March than was the case in the U.S.).
Consequently, Canada is benefitting from a ‘low base effect’ in year-over-year jobs-count percentage-change calculations sooner than America.
With March’s strong labour market report from Statistics Canada, featuring a month-to-month climb in jobs of +303,000, Canada is now +3.9% in total employment y/y.
Only one more month of a similar jobs gain (+300,000) would lift Canadian total employment to a level even with February of last year, before there were any negative impacts from the health crisis.
Canada’s seasonally adjusted (SA) unemployment rate in March eased to 7.5% from 8.2% in the prior month. The not seasonally adjusted (NSA) unemployment rate, calculated using the same methodology as is adopted south of the border, fell to 6.9% from 7.3% in the previous month.
Graph 1: Canada: Month-to-month Total Employment Change
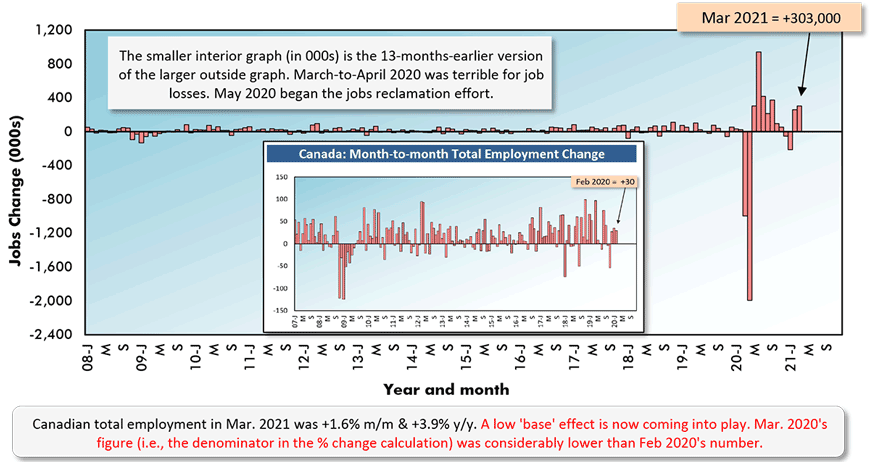
Chart: ConstructConnect.
‘Return to Normalcy’ Gauge Climbs to 90%
An important gauge of the ‘return to normalcy’ is the jobs recover ratio (a.k.a., the jobs ‘claw-back’ ratio), which measures the degree to which employment has been restored relative to last Spring’s big cuts.
With March’s labour market report, Canada’s jobs claw-back ratio is now a quite respectable 90.1%. The comparable U.S. figure is still under 60.0%.
The claw-back ratio in Canada’s manufacturing sector is over 100%, meaning that staffing on production lines is back to where it was before the pandemic.
The public sector’s claw-back ratio is 172.5%, indicating that not only have all vacated positions with government been re-filled, but some extra hiring has been undertaken for good measure. (Year-over-year public sector employment is currently +7.2%.)
Where there’s still a big problem, though, is in the ‘accommodation and food services’ sector, which is presently sitting with a claw-back ratio of only 50.3%.
Payrolls in Canada’s construction sector increased by +26,000 jobs in March, raising the ‘hard hat’ jobs claw-back ratio to 91.6%. (Year-over-year employment in construction, though, is nothing to get excited about, at -1.6%).
Table 1: Monitoring the Canadian Employment Recovery ‒ March 2021
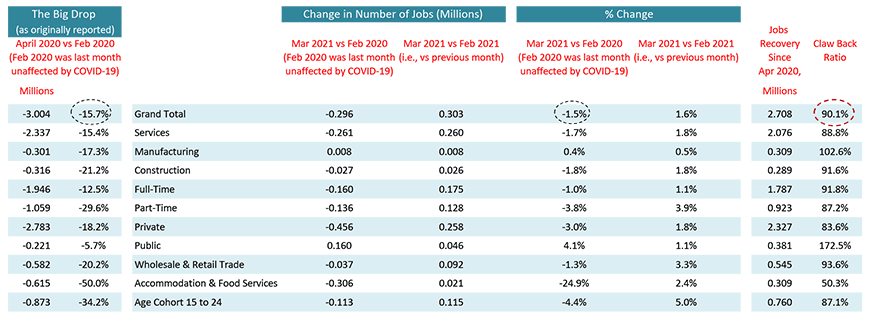
Table: ConstructConnect.
Table 2: U.S. and Canadian Jobs Markets – March 2021
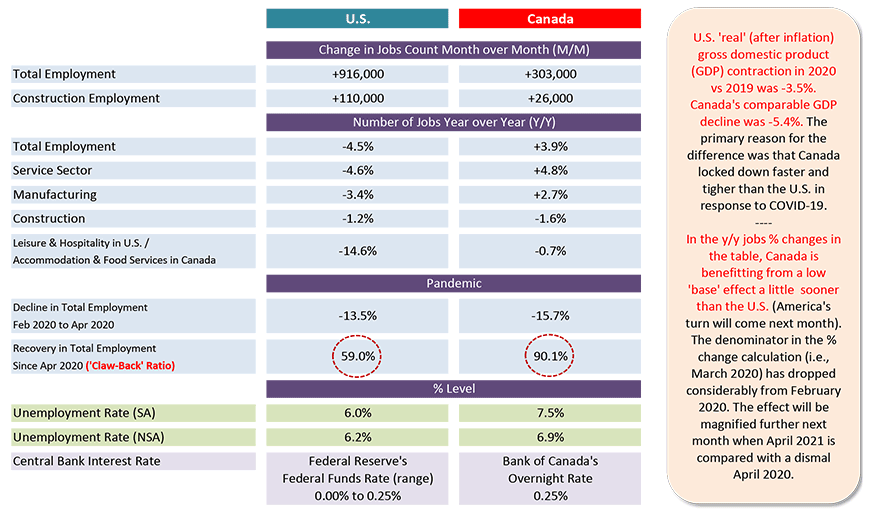
U.S. labor data is from a ‘payroll survey’ / Canadian labour data is from a ‘household survey’.
Canadian NSA unemployment rate ‘R3’ is adjusted to U.S. concepts (i.e., it adopts U.S. equivalent methodology).
Table: ConstructConnect.
Graph 2: Canada ‘R-3’ Unemployment Rate vs U.S. Unemployment Rate
Not Seasonally Adjusted (NSA) Data (Statistics Canada calculates ‘R-3’ on same basis as U.S. rate)
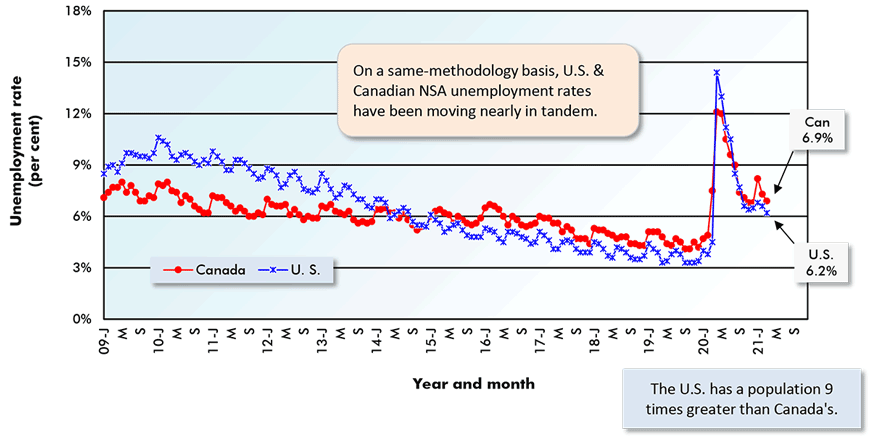
Chart: ConstructConnect.
Graph 3: Change in Total Employment – Canada vs U.S.
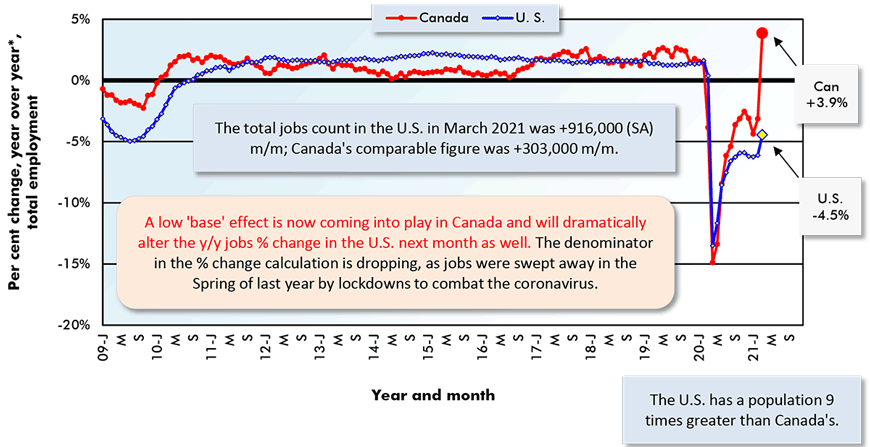
‘Y/Y’ is current month/same month previous year; ‘m/m’ is current month vs prior month.
Chart: ConstructConnect.
Ontario the Winner in March; B.C. the Winner Overall
Ontario made up a lot of ground on the employment front in March. Of the +303,000 jobs in total for Canada, +182,000 (60%) of them were situated in Ontario. The ‘Yours-to-Discover’ province now sports a jobs recovery ratio of 82.9%, much improved from the 66% it was carrying just a month ago.
The accompanying charts on provincial labor markets make it clear, though, that there’s one frontrunner well ahead of the rest of the pack, British Columbia. That province has a claw-back ratio of 130.8%, moving it well past employment recovery and into the next jobs creation phase.
From Graph 4, B.C. is in first place for year-over-year jobs change, +6.2%, and it’s in third spot in a ranking of unemployment rates, from lowest to highest.
As a final note, the ‘gig’ jobs market may have been battered over the past year, but it’s still a formidable force. The total number of full-time jobs in Canada is +2.1% y/y, but part-time work is a roaring +12.8%.
Table 3: Provincial Employment ‘Claw-Back’ Ratios – March 2021
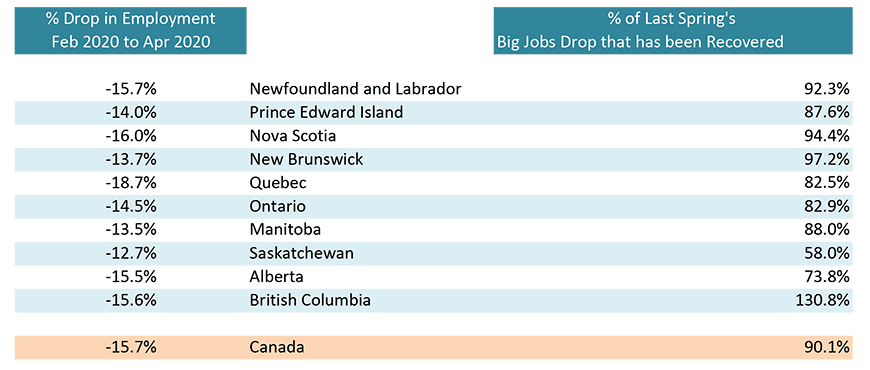
Table: ConstructConnect.
Graph 4: Canada’s Provincial Labour Markets – March 2021
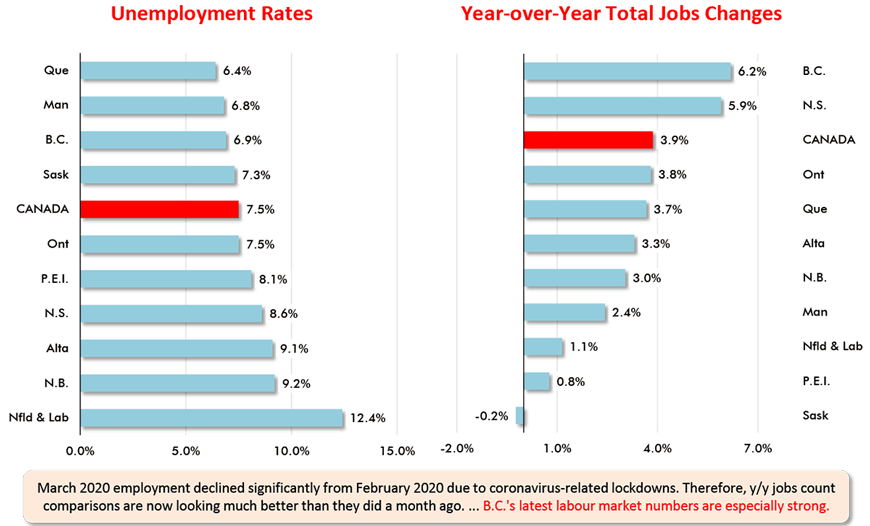
Chart: ConstructConnect.
Table 4: Canada’s Provincial Labour Markets – March 2021
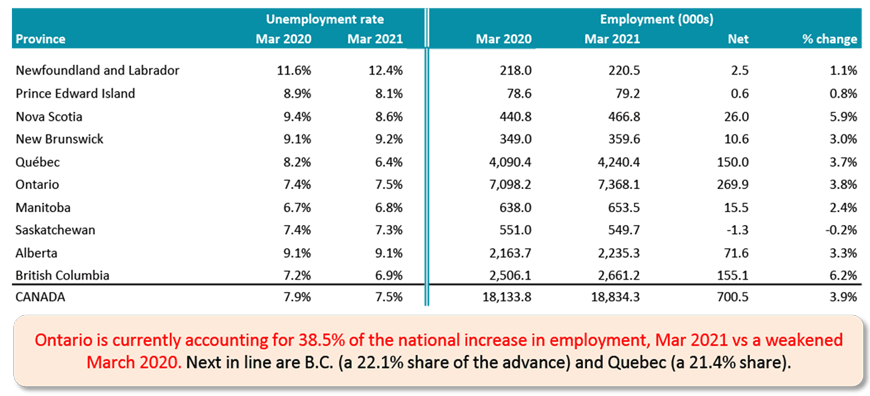
Table: ConstructConnect.
Please click on the following link to download the PDF version of this article:
Economy at a Glance Vol. 17, Issues 60 and 61 – Canada’s March Jobs Report a Confidence Builder – PDF
Alex Carrick is Chief Economist for ConstructConnect. He has delivered presentations throughout North America on the U.S., Canadian and world construction outlooks. Mr. Carrick has been with the company since 1985. Links to his numerous articles are featured on Twitter @ConstructConnx, which has 50,000 followers.


Recent Comments
comments for this post are closed