
According to the U.S. Bureau of Labor Statistics (BLS), U.S. total employment in March increased by +916,000 jobs. The increase was really over a million if the upwards revision to February’s originally reported number is also included.

Jumps of this magnitude will continue to be sorely needed in the months ahead, as the total number of jobs in the economy is still 6.7 million less than at this time last year.
The seasonally adjusted (SA) unemployment rate in March improved to 6.0% from 6.2% in February. The not seasonally adjusted (NSA) unemployment rate fell to 6.2% from 6.6% in the month prior.
Graph 1: U.S.: Month-to-month Total Jobs Creation
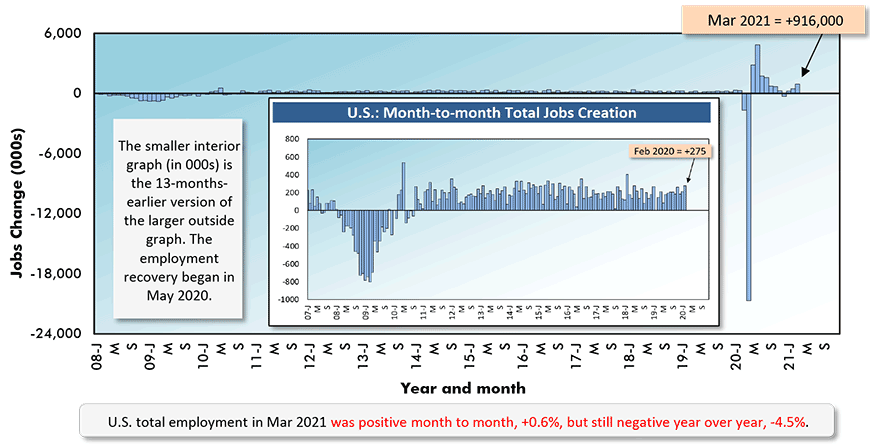
Chart: ConstructConnect.
Government Work a Drag on Jobs Recovery
The jobs recovery ratio, versus the big drop in employment that occurred between February and April of last year, has picked up to just under 60% (see top right-hand figure in Table 1). But that means there’s still a long way to go.
Not surprisingly, the industrial sub-sector with the best jobs recovery ratio (a.k.a., ‘claw-back’ ratio) is ‘transportation and warehousing’, 88.7%. Goods purchased over the Internet don’t just magically appear on people’s doorsteps. Achieving speedy and efficient logistics has moved up to become a paramount key to business success.
The ‘leisure and hospitality’ sector suffered the sharpest contraction in jobs last Spring, -46.8% year over year, but it has managed to restore 59% of those positions.
‘Government’ staffing is taking away from the overall employment recovery. The public sector jobs count fell between February and April 2020 by about a million. Subsequent to that retreat, today’s public sector jobs count is further in arrears by -242,000, despite a substantial pickup in the latest month, +136,000, which came more than half in the field of ‘local education’.
Table 1: Monitoring the U.S. Employment Recovery – March 2021
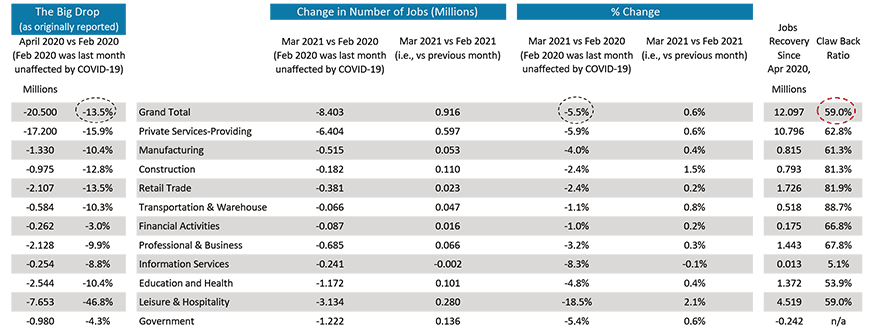
Chart: ConstructConnect.
Construction Hiring a Highlight in March
The construction sector was a major contributor to the +916,000 economy-wide jobs gain in March. ‘Hard hat’ staffing shot up by +110,000, helping to erase the memory of a -56,000 decline just one month previously.
The composition of construction’s month-to-month total jobs increase is laid out in Graph 2. Nonresidential sub-trades (+38,000), followed by residential sub-trades (+27,000) and engineering/civil contractors (also +27,000) undertook the most hiring in the month.
Construction’s NSA unemployment rate in March dropped by a percentage point month to month from 9.6% to 8.6%. But in March of last year, it had been 6.9%.
Be aware that the tone of year-over-year comparisons will soon change dramatically and for the better, thereby engendering more confidence concerning the outlook.
A month from now, when April 2021’s labor market statistics are being quoted, the prior year’s unemployment rate for construction of 16.6% will place the latest results in a much better light.
From Table 1, the jobs recovery ratio in construction is a respectable 81.3%.
Graph 2: Change in Level of U.S. Construction Employment, Month to Month (M/M) −
Total & by Categories – March, 2021
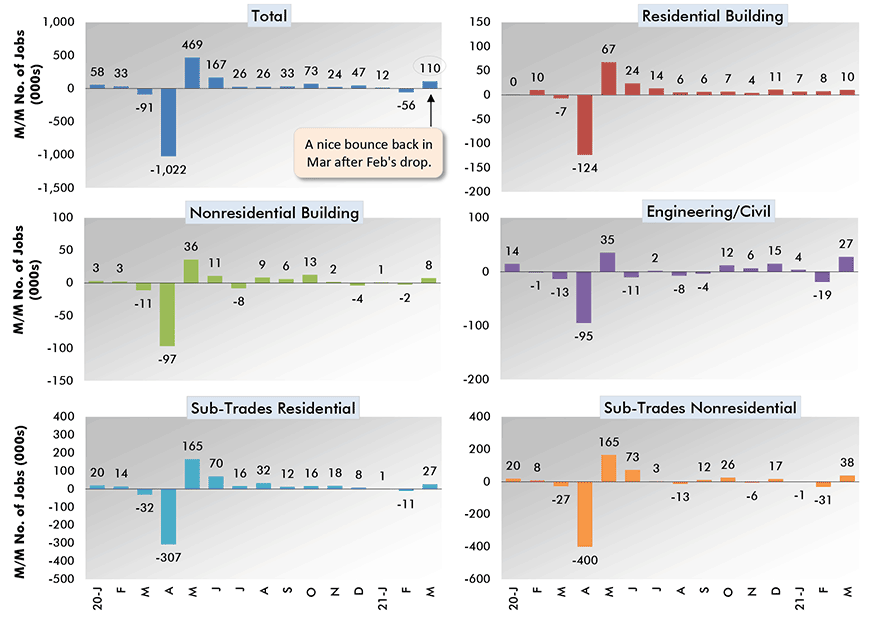
Chart: ConstructConnect.
Graph 3: Y/Y Jobs Change, U.S. Total Industry & Major Subsectors − March 2021
(based on seasonally adjusted payroll data)
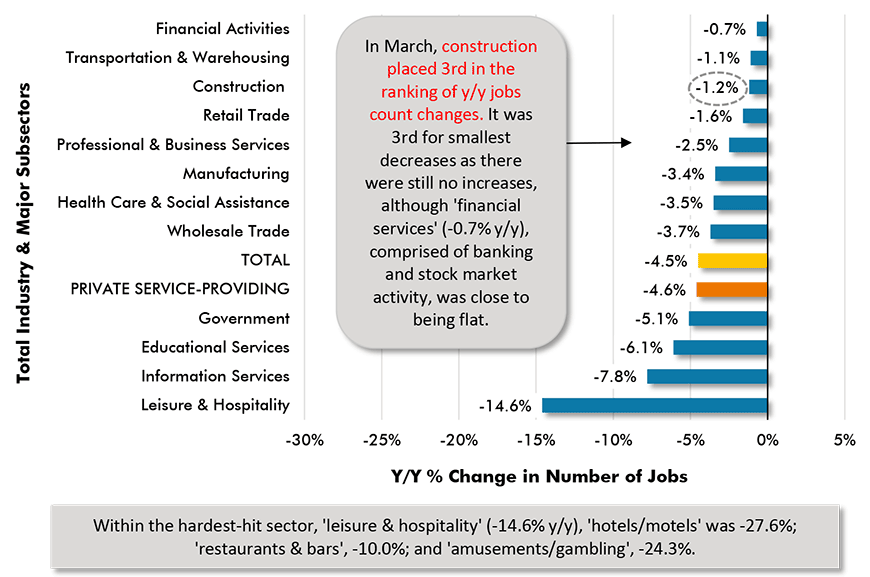
Chart: ConstructConnect.
Construction Workers Still Falling Short on Compensation Front
Construction workers are still falling short on the compensation front. While ‘all jobs’ y/y earnings were +4.2% hourly and +6.7% weekly in March, construction workers were being paid +2.5% hourly and +3.8% weekly.
Removing supervisors from the mix, the disparities were even greater. The hourly side-by-side comparison was +4.4% to +2.4%; the weekly match-up was +7.2% to +4.0%.
Graphs 4 and 5 feature earnings results for production and nonsupervisory employees (i.e., workers other than bosses).
Graph 4: Average Hourly Earnings Y/Y – ‘All Jobs’ & Construction
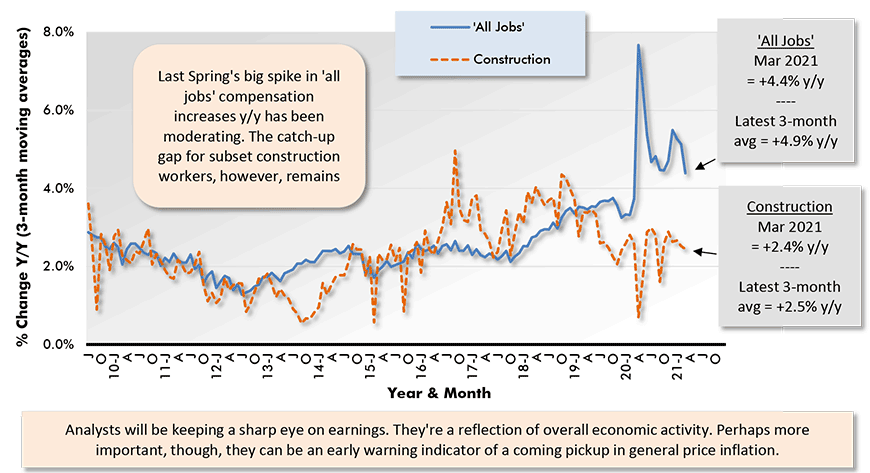
Chart: ConstructConnect.
Graph 5: Average Weekly Earnings Y/Y – ‘All Jobs’ & Construction
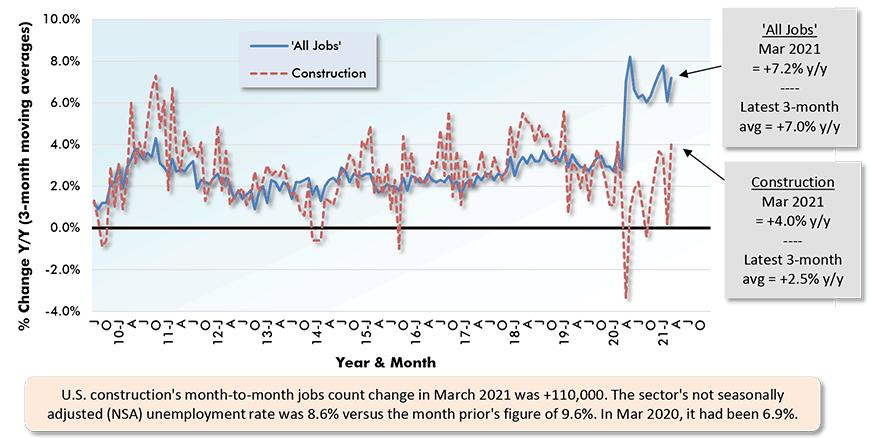
Chart: ConstructConnect.
A Banner Event for Initial Jobless Claims
Before closing, let’s have a look at what may be my favorite leading economic indicator of all, and not just concerning the U.S. labor market, initial jobless claims.
A banner event appeared in the latest weekly report. Revisions to the data series were published and they show March 20, 2021’s number falling to 658,000, marking the first time in a year that initial jobless claims have been lower than they were at their peak in the 2008-09 recession.
Going forward, they need to register further significant improvement. Unfortunately, for the latest week ending March 27th, they bobbed back up to 719,000.
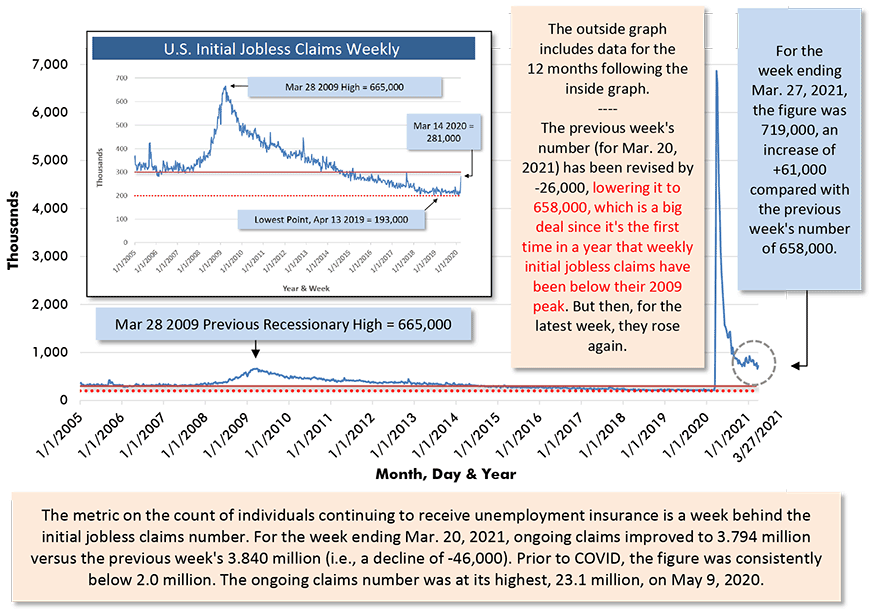
Chart: ConstructConnect.
Please click on the following link to download the PDF version of this article:
Economy at a Glance Vol. 17, Issues 57, 58 and 59 – March’s U.S. Jobs Report Delivers What’s Needed – PDF
Alex Carrick is Chief Economist for ConstructConnect. He has delivered presentations throughout North America on the U.S., Canadian and world construction outlooks. Mr. Carrick has been with the company since 1985. Links to his numerous articles are featured on Twitter @ConstructConnx, which has 50,000 followers.


Recent Comments
comments for this post are closed