Due to its complexity, much of the subject matter concerning the economy requires detailed editorial commentary, often supported by relevant tables and graphs.
At the same time, though, there are many topics (e.g., relating to demographics, housing starts, etc.) that cry out for compelling ‘shorthand’ visualizations.
Whichever path is followed, the point of the journey, almost always, is to reach a bottom line or two.
To provide additional value, ConstructConnect is now pleased to offer an ongoing series of 1,000-word charts.
These will help readers sort out the ‘big picture’ more clearly.
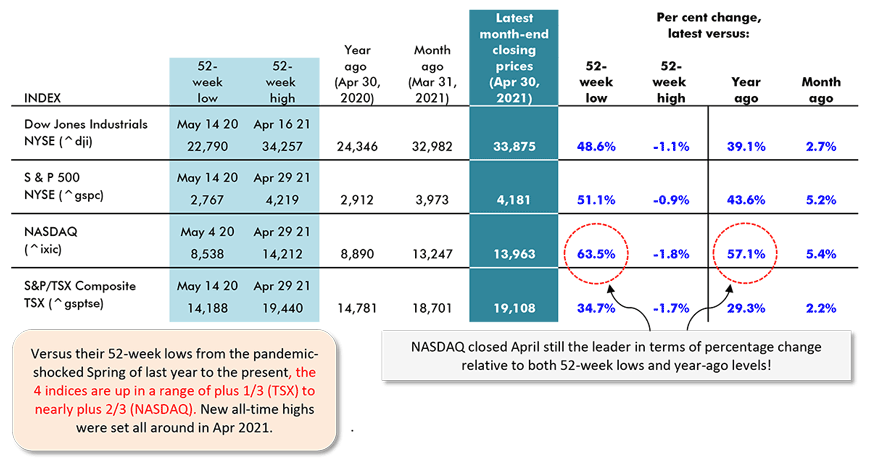
These 1,000-word charts look at the performances of the key stock market indices as of April 30, 2021.
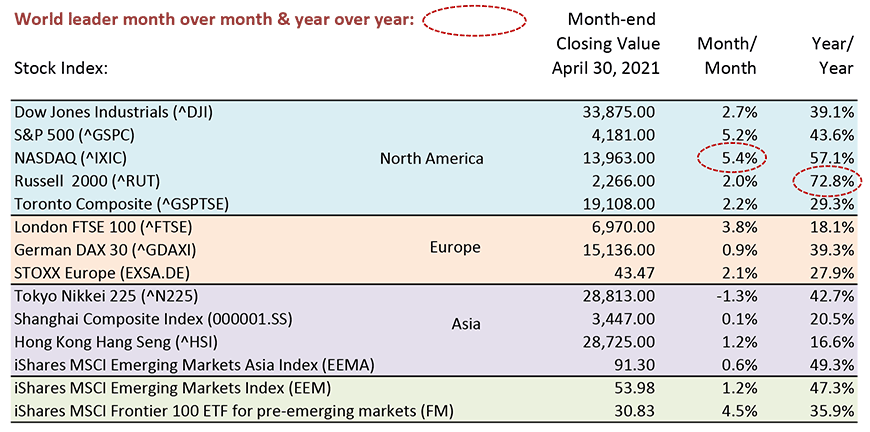
Table 1: Stock exchanges – performances of key indices – April 30, 2021
Sources: New York Stock Exchange (NYSE), Standard and Poor’s (S & P), National Association of
Securities Dealers Automated Quotations (NASDAQ), Toronto Stock Exchange (TSE) and Reuters.
Table: ConstructConnect.
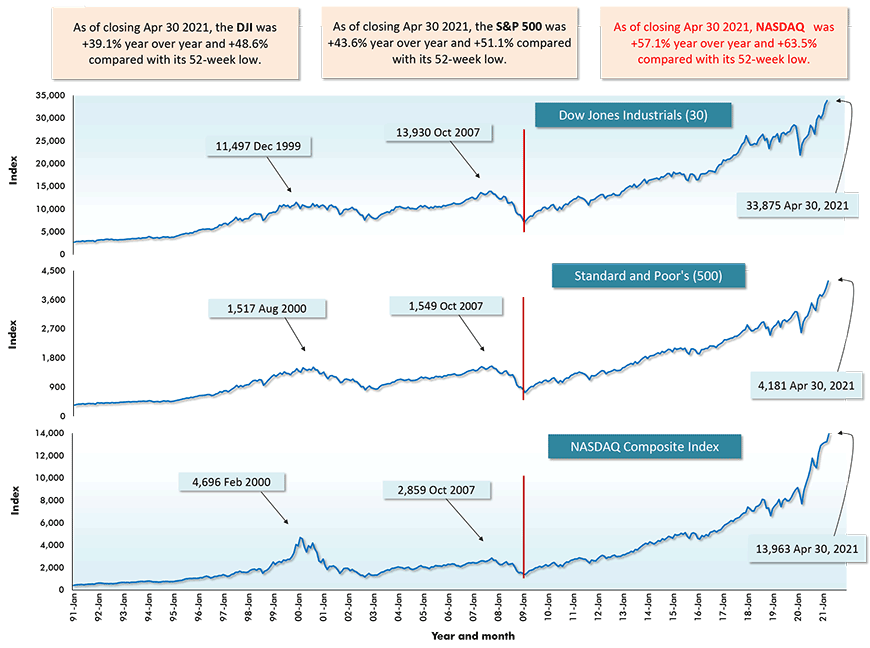
Graph 1: U.S. Stock Markets − April 30, 2021
Latest data points are for Apr. 30, 2021.
Red vertical lines denote Feb 2009 major ‘troughs’ for the indices.
Data sources: New York Stock Exchange (NYSE), Standard and Poor’s (S & P), National Association of
Securities Dealers Automated Quotations (NASDAQ), Reuters & Yahoo.
Chart: ConstructConnect.
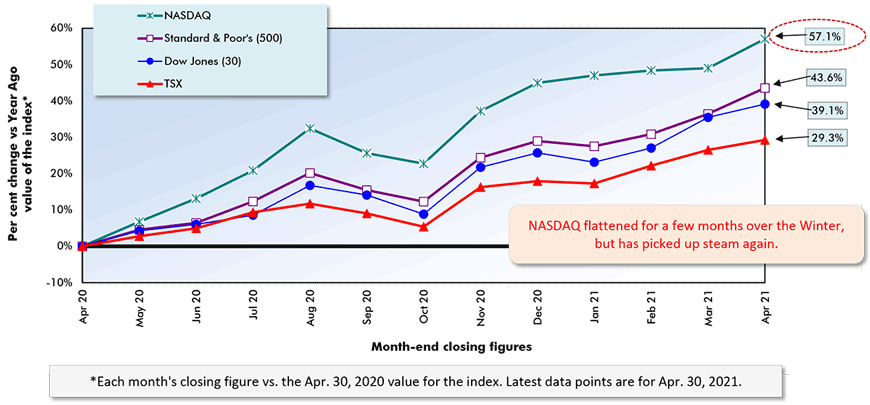
Graph 2: Performances of key stock market indices during latest year
Data sources: New York Stock Exchange (NYSE), Standard and Poor’s (S & P), National Association of
Securities Dealers Automated Quotations (NASDAQ), Toronto Stock Exchange (TSE) and Reuters.
Chart: ConstructConnect.
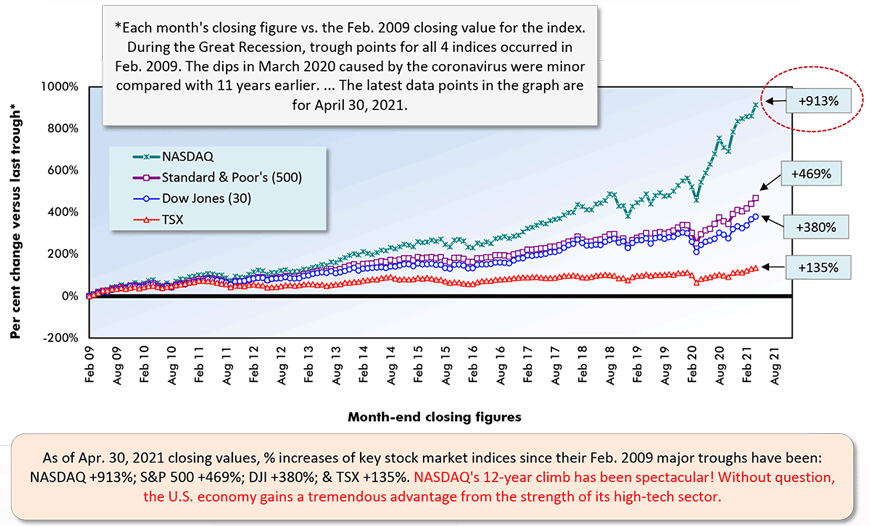
Graph 3: Performances of key stock market indices since 2008-09 downturn
Data sources: New York Stock Exchange (NYSE), Standard and Poor’s (S & P), National Association of
Securities Dealers Automated Quotations (NASDAQ), Toronto Stock Exchange (TSE) and Reuters.
Chart: ConstructConnect.
Table 2: Key Domestic & International Stock Market Indices – April 30, 2021
‘"Ticker symbols" are in brackets. MSCI (formerly Morgan Stanley Capital International) is a leading provider of investment decision support tools, with indices as one specialty. "iShares" is a web site that specializes in "exchange traded funds", or ETFs, managed by BlackRock Investments LLC.
Data Source: ‘finance.yahoo.com’
Table: ConstructConnect.
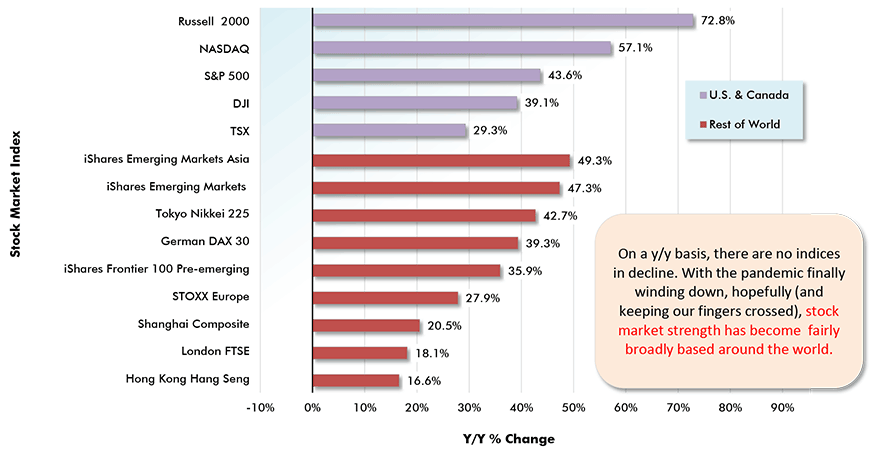
Graph 4: Stock Market Performances: U.S. & Canada vs Rest of World
Year over Year as of Month-end Closings, April 30, 2021
iShares is a web site that specializes in “exchange traded funds”, or ETFs, managed by BlackRock Investments LLC.
Data Source: ‘finance.yahoo.com’
Chart: ConstructConnect.
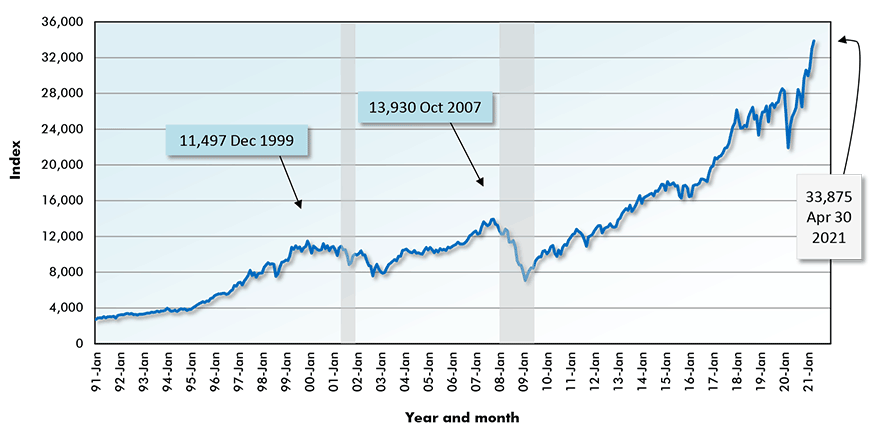
Graph 5: New York Stock Exchange: Dow-Jones Industrials (30)
Areas of gray shading denote century’s 2 prior recessions (‘dot.com’ collapse in 2001 & Great Recession Q1 08 to Q2 09). The chart shows month-end closing figures. The latest data point is for April 30, 2021.
Data sources: New York Stock Exchange (NYSE), Standard and Poor’s (S & P), National Association of
Securities Dealers Automated Quotations (NASDAQ), Toronto Stock Exchange (TSE) and Reuters.
Chart: ConstructConnect.
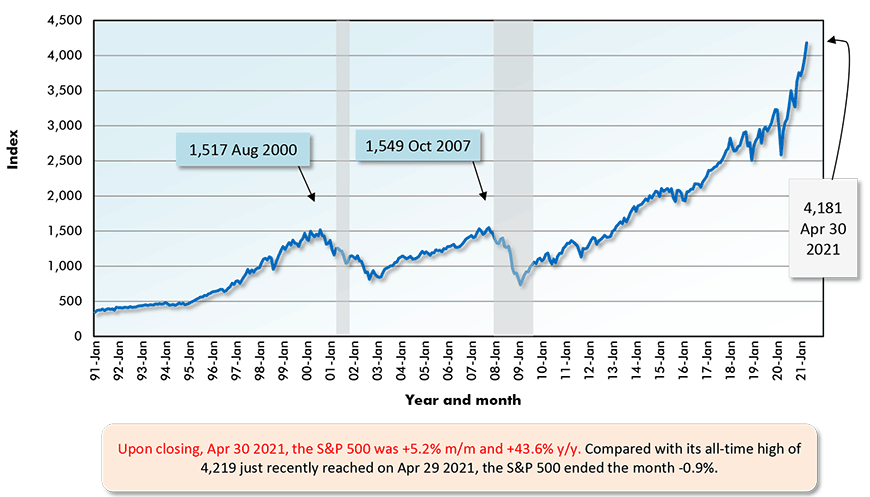
Graph 6: New York Stock Exchange: Standard and Poor’s (500)
Areas of gray shading denote century’s 2 prior recessions (‘dot.com’ collapse in 2001 & Great Recession Q1 08 to Q2 09). The chart shows month-end closing figures. The latest data point is for April 30, 2021.
Data sources: New York Stock Exchange (NYSE), Standard and Poor’s (S & P), National Association of
Securities Dealers Automated Quotations (NASDAQ), Toronto Stock Exchange (TSE) and Reuters.
Chart: ConstructConnect.
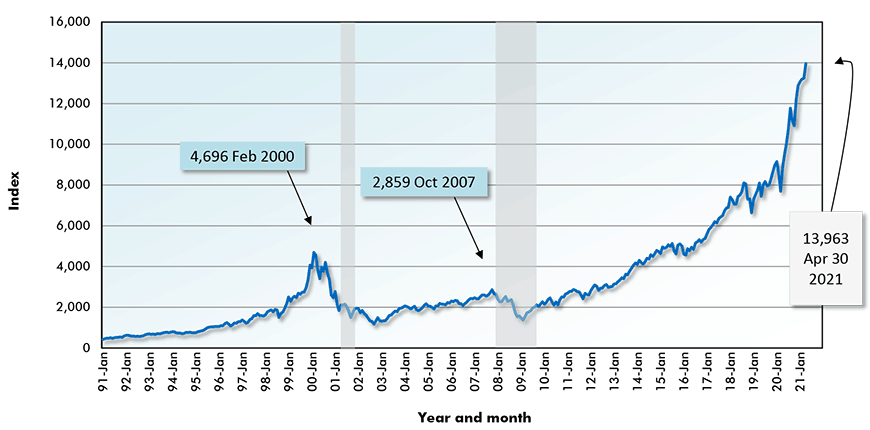
Graph 7: NASDAQ Composite Index
Areas of gray shading denote century’s 2 prior recessions (‘dot.com’ collapse in 2001 & Great Recession Q1 08 to Q2 09). The chart shows month-end closing figures. The latest data point is for April 30, 2021.
Data sources: New York Stock Exchange (NYSE), Standard and Poor’s (S & P), National Association of
Securities Dealers Automated Quotations (NASDAQ), Toronto Stock Exchange (TSE) and Reuters.
Chart: ConstructConnect.
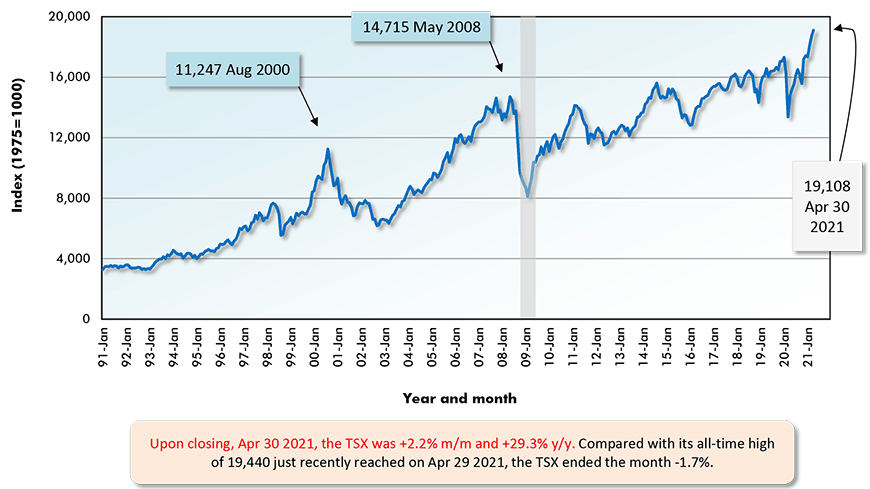
Graph 8: S&P/TSX Composite Index: Toronto Stock Exchange
Area of gray shading denotes Canada’s earlier recession in current century (Q4 2008 to Q2 2009; no ‘dot.com’ collapse). The chart shows month-end closing figures. The latest data point is for April 30, 2021.
Data sources: New York Stock Exchange (NYSE), Standard and Poor’s (S & P), National Association of
Securities Dealers Automated Quotations (NASDAQ), Toronto Stock Exchange (TSE) and Reuters.
Chart: ConstructConnect.
Please click on the following link to view the latest stock market charts and tables for the U.S. and Canada: CanaData Forecaster Charts & Tables – Stock Markets.


Recent Comments
comments for this post are closed