
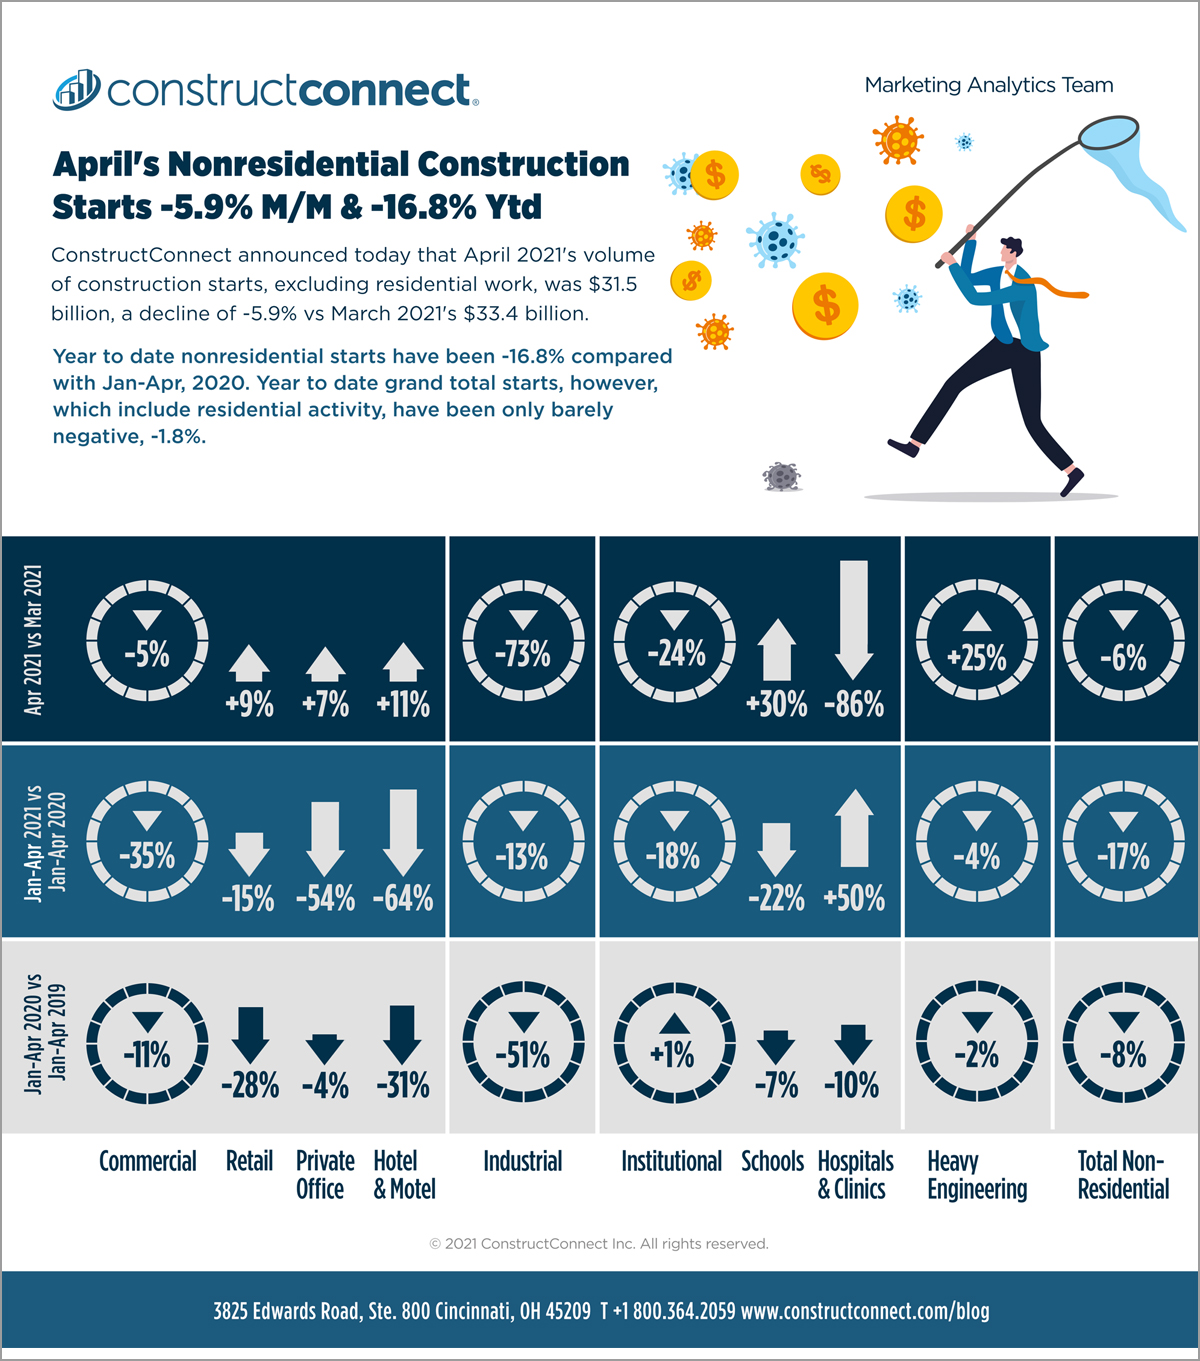
ConstructConnect announced today that April 2021’s volume of construction starts, excluding residential work, was $31.5 billion, a decrease of -5.9% versus March 2021’s $33.4 billion (originally reported as $32.2 billion). The m/m pullback was entirely due to softness in nonresidential building starts, -23.4%, as heavy engineering/civil starts were +25.3%.

Click here to read the complete April 2021 Industry Snapshot article, April’s Nonresidential Construction Starts -5.9% M/M & -16.8% YTD – below is a short excerpt.
Year-to-date nonresidential starts through the fourth month of this year were -16.8% versus Jan-Apr 2020. Nonresidential building and engineering year-to-date performances have been -24.6% and -3.5% respectively.
View this information as an infographic.
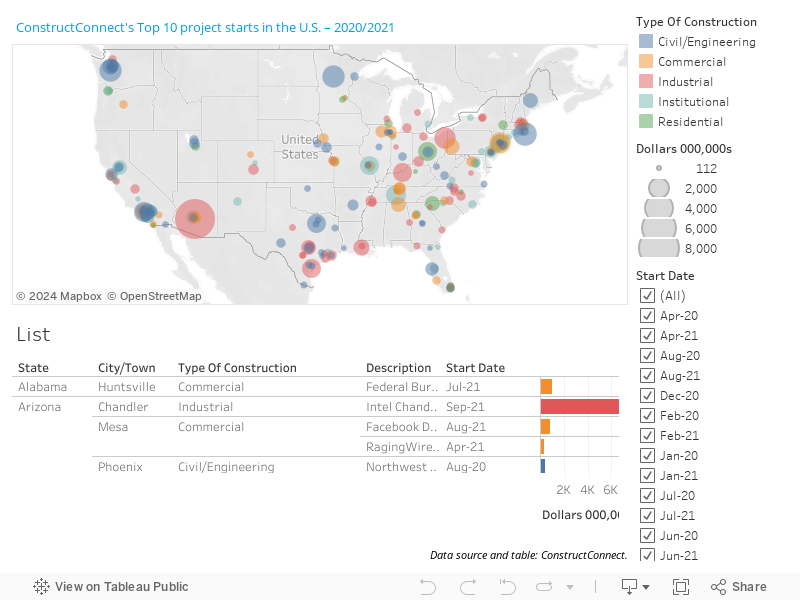
Perhaps in a sign of what’s to come, with Washington’s greater emphasis on carbon-free energy generation, two of the three largest (by dollar volume) initiations in the latest month were wind power projects, at approximately half a billion dollars each, located in Missouri and Texas (see Top 10 Project Starts in the U.S. – April 2021).
Including residential activity, grand total starts in April were +4.8% month to month and a barely negative -1.8% year to date. Residential work on its own was quite strong, +17.4% m/m and +21.6% ytd.
From now (i.e., April 2021 statistics) through the remainder of this year, it will be important to keep in mind that an extraordinary effect will be distorting year-over-year comparisons. Through Q1 of last year, groundbreakings were ‘normal.’ They weren’t being impacted by economy-wide shutdowns to combat coronavirus infections.
Therefore, early 2021 relative to early 2020 percentage changes have been skewed downwards by a high base (denominator) in the mathematical calculation. Moving forward, an opposite bias will come into play. Last year’s comparison numbers from late Spring on suffered from COVID-19-induced suppression.
Click here to download the Construction Industry Snapshot Package – April 2021 PDF.
Click here for the Top 10 Project Starts in the U.S. – April 2021.
Click here for the Nonresidential Construction Starts Trend Graphs – April 2021.
Alex Carrick is Chief Economist for ConstructConnect. He has delivered presentations throughout North America on the U.S., Canadian and world construction outlooks. Mr. Carrick has been with the company since 1985. Links to his numerous articles are featured on Twitter @ConstructConnx, which has 50,000 followers.
Interactive Visual
View this video to see how to use the filters in the Interactive Visual.


Recent Comments
comments for this post are closed