
Bar and Restaurant Sales Recovery
I don’t know why this hasn’t received more attention and I’m finding it a little hard to believe, given that there are still pockets of the economy that have not fully re-opened, but according to the Census Bureau, sales by food services and drinking places (i.e., bars and restaurants) have climbed to a level slightly above where they were prior to the pandemic.

This is a remarkable achievement. Graph 1 shows the disastrous decline in the activity level of this sector in the Spring of 2020, when the arrival of the coronavirus confined gourmands and watering hole patrons to their homes.
The toll on the employment of young adults was especially severe. Now, finally, their prospects are looking brighter again. But now, also, the debate over whether they are paid enough heats up.
Resistance to raising minimum wages will be butting heads with an unprecedented new problem, a difficulty in finding enough willing workers to fill open positions in the hospitality (and many other) sectors.
Graph 1: U.S. Sales by Food Services & Drinking Places
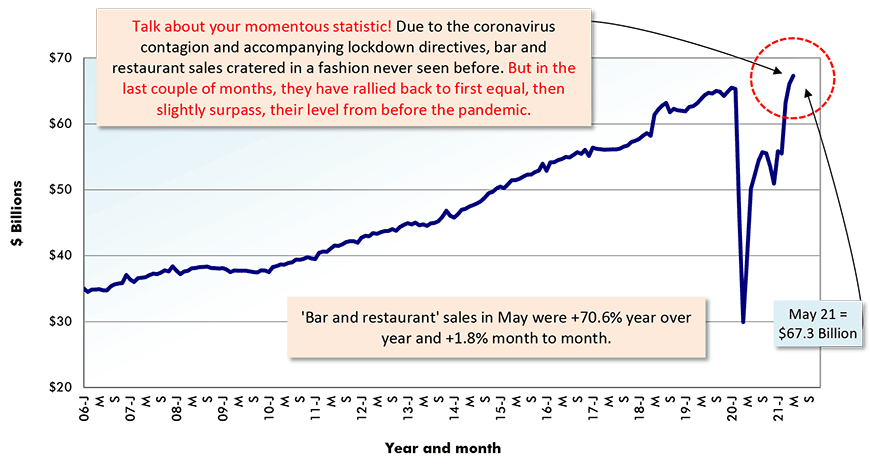
Adjusted for seasonal variation, holiday and trading day differences, but not for price changes.
Chart: ConstructConnect.
A Costing Structure Leading to Casualties
Graph 2 illustrates, in stark fashion, the dilemma facing contractors. The Producer Price Index (PPI) data series calculated and published by the Bureau of Labor Statistics (BLS) includes two measures designed specifically to capture what is happening with construction materials ̶ i.e., a materials ‘input’ index and a materials ‘special grouping’ index. Both have been increasing swiftly over the past six months.
On a year-over-year basis, the materials ‘grouping’ index is +30.0%; the materials ‘input’ index, +24.0%.
The PPI’s construction ‘final demand’ index, however, which is essentially a ‘bid price’ index, is only +2.8% y/y.
With the number of construction projects in the preparation stage continuing to lag historic availability, contractors are being forced to keep their ‘asking prices’ low, meaning they’re having to absorb extraordinary cost hikes internally. If this situation persists, it will inevitably lead to some rather severe casualties.
Graph 2: U.S. Construction Bid Prices vs Material Input Costs
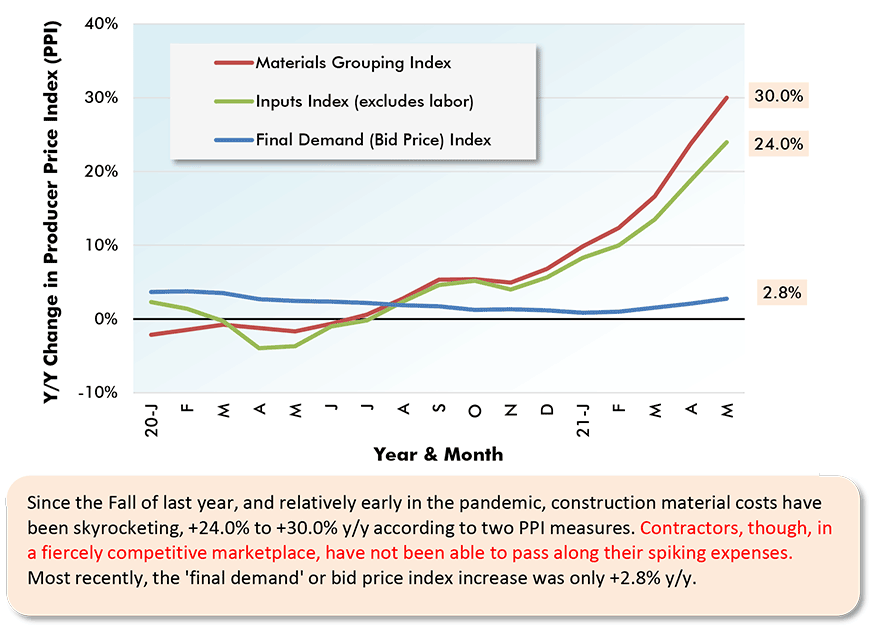
Chart: ConstructConnect.
Bonus Chart – Building Material Suppliers Retail Sales
I’m adding an extra or bonus chart. Graph 3 records year-over-year sales by building material supplies.
The building material cost increases referred to previously, especially for lumber and other forestry products such as plywood, play a role in bumping up the ‘current’ (i.e., not adjusted for inflation) dollar sales of building material suppliers.
Just the same, the year-over-year +33.1% or one-third sales increase for April 2021 was double any prior best result since 2000.
Moreover, it’s become common for me lately to partially explain away such large jumps by saying they’re due to a ‘low base’ effect.
The ‘low denominator’ argument does not apply in this instance, however. At no time in 2020, while COVID-19 was slicing and dicing the economy, did building material and supply dealer sales decline year over year.
Graph 3: Sales by U.S. Building Material & Supplies Dealers
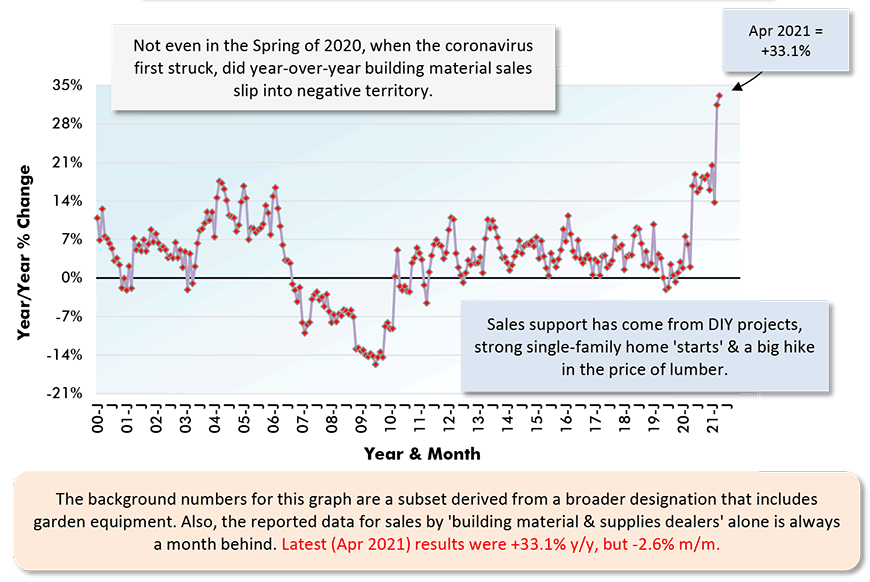
Chart: ConstructConnect.
Please click on the following link to download the PDF version of this article:
Economy at a Glance Vol. 17, Issue 100 – An Unusual Economy – Two Stunning Charts, Plus a Bonus Chart – PDF
Alex Carrick is Chief Economist for ConstructConnect. He has delivered presentations throughout North America on the U.S., Canadian and world construction outlooks. Mr. Carrick has been with the company since 1985. Links to his numerous articles are featured on Twitter @ConstructConnx, which has 50,000 followers.


Recent Comments
comments for this post are closed