
ConstructConnect’s Expansion Index ties to the inventory of all the projects the company has in its data base that are in the planning stage, ahead of ‘starts’ or when ground is broken.

The index, which can also be referred to as a ratio, fluctuates around the number 1.0. For any geographic designation (national, state, province or city), the index value is the dollar volume of planned projects in any given month compared with and divided by the dollar volume of planned projects for the same month of the year previously.
By the way, ConstructConnect also calculates Expansion Index numbers for various types of structure, but that’s a story for another day.
Below are five graphs showing the histories of the Expansion Index, back to January 2020, for ‘total U.S.’ and the nation’s four most populous states – California Texas, New York and Florida.
As explained in the footnote under each graph, the index figure will stay above 1.0 during normal cyclical growth and with the help of some degree of inflation. It will shoot well beyond 1.0 for a region when there is a surge in projects in the planning stage, or when some significant new mega projects enter the planned-projects inventory maintained by ConstructConnect’s Research Team.
On the flip side, there are three key reasons for a plunge in the index towards 1.0 or below it: (1) a mega project or two moves from planning to ‘start’; (2) projects are put on hold or cancelled due to an extraordinary event, such as occurred in the Spring of 2020 at the beginning of the coronavirus pandemic; and (3) when the building cycle turns decidedly negative.
There’s also another aspect of the Expansion Index that renders it a particularly powerful tool.
Due to the fact the percentage difference between the current Expansion Index reading versus the baseline figure of 1.0 gives the percentage change in the volume of planned projects y/y, relative strength can be established across geographic designations. Or between types-of-structures.
A Reluctance by Owners to Commit
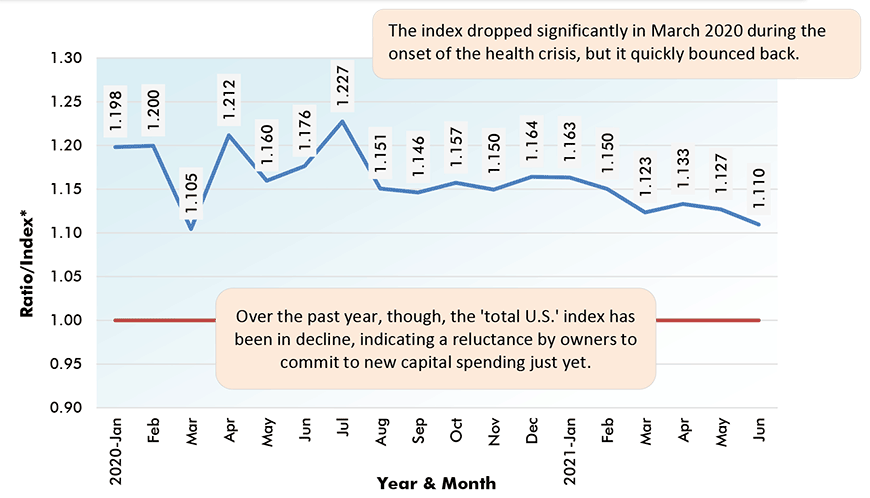
From Graph 1, the ‘total U.S.’ index dropped significantly in March 2020 during the onset of the health crisis, but it quickly bounced back. Construction activity was judged ‘essential’ by most government bodies and was given clearance to proceed.
Over the past year plus, though, as lockdowns sent the economy reeling at various times, the total U.S. index has been in decline, and is not yet showing signs of picking up again. Construction lags a recovery in the general economy. The ongoing weakness in the index indicates a reluctance by owners to commit to new capital spending just yet.
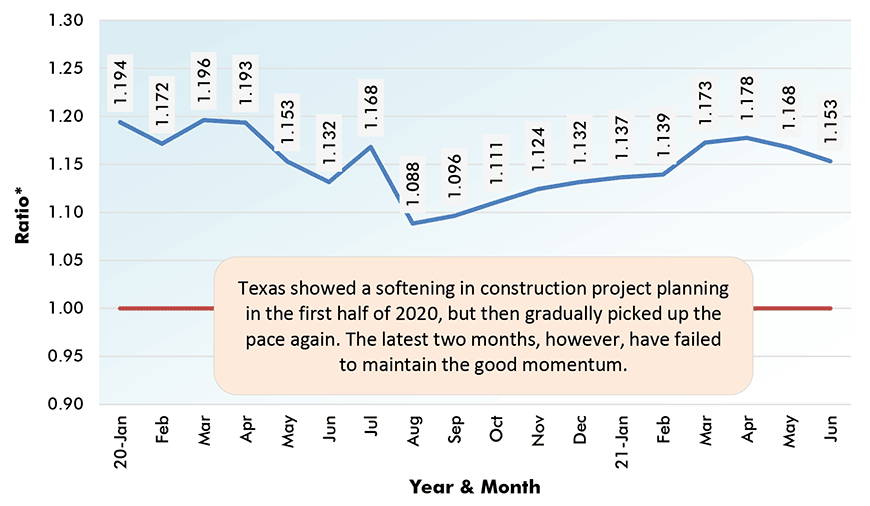
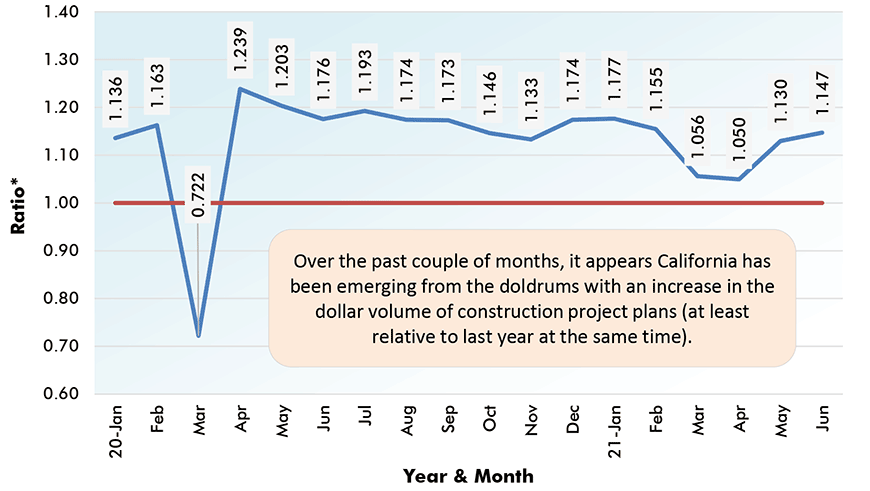
For the four states in Graphs 2 through 5, California is perhaps demonstrating the best recovery in planned construction projects, although its latest index reading of 1.147 implies a dollar volume change in such work y/y (i.e., +14.7%) that is less than what Texas is seeing, even though the Lone Star state’s curve is mildly descending. The 1.153 index figure for Texas represents a 15.3% y/y increase in dollar volume of planned projects.
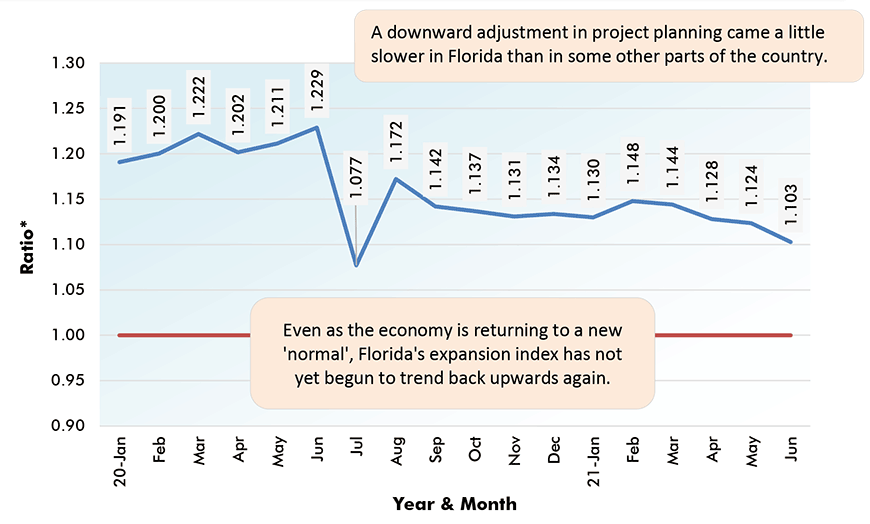
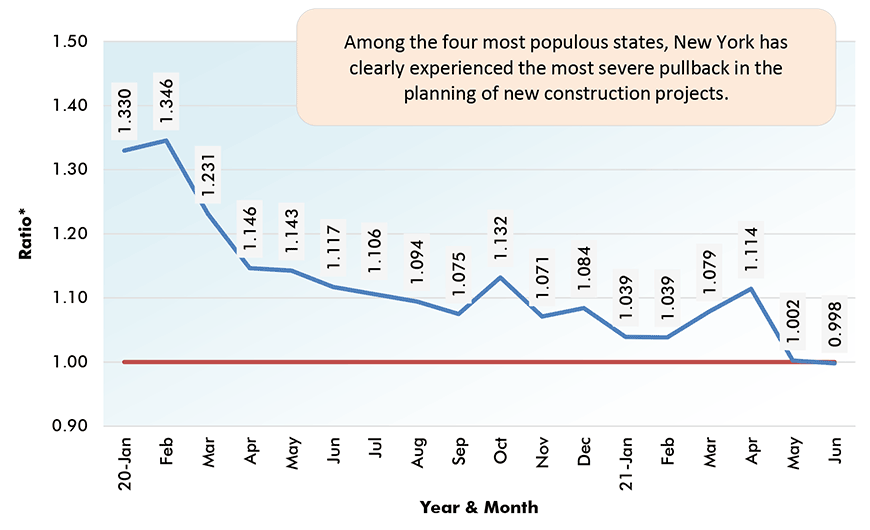
Clearly, New York (Graph 5) among the four most populous states, is facing the most daunting task in trying to re-establish a healthy number of planned projects. Florida (Graph 4) needs to pick up the pace as well.
($ Volume of Projects in Planning Stage Each Month vs Same Month, Previous YR)
($ Volume of Projects in Planning Stage Each Month vs Same Month, Previous YR)
($ Volume of Projects in Planning Stage Each Month vs Same Month, Previous YR)
($ Volume of Projects in Planning Stage Each Month vs Same Month, Previous YR)
($ Volume of Projects in Planning Stage Each Month vs Same Month, Previous YR)
Please click on the following link to download the PDF version of this article:
Economy at a Glance Vol. 17, Issue 93 – ConstructConnect’s ‘Expansion Index’ Captures Construction Hesitancy – PDF
Alex Carrick is Chief Economist for ConstructConnect. He has delivered presentations throughout North America on the U.S., Canadian and world construction outlooks. Mr. Carrick has been with the company since 1985. Links to his numerous articles are featured on Twitter @ConstructConnx, which has 50,000 followers.


Recent Comments
comments for this post are closed