Coming out of the pandemic, the U.S. economy is primed to ‘roar’, with GDP growth expected to be near +7% year over year in 2021, although moderating afterwards. Consumers have confidence and cash, having padded their wallets and purses after experiencing reduced outlets for spending during the several waves of lockdowns over the past year plus.

Interest rates will be stepping up a little faster than the Federal Reserve first intended. How quickly will be dependent on the performance of inflation. World trade will soon be accelerating, and a new round of commodity price increases appears imminent. Oil is back above $70 USD per barrel.
Labor is emerging from the health crisis with a new ‘take’ on life. Working from home has been confirmed as a viable option. A trend towards less globalization and record high unfilled job openings provide prospective employees with more options. Restraints on wage increases will weaken as the offshoring of work loses much of its appeal.
The mix of construction activity that has recently been favoring residential activity over nonresidential will gradually shift back to a more normal pattern. Infrastructure works, backed by government spending and partnerships with the private sector, will move to a higher level of prioritization.
Download this article as a PDF.
The graphs and accompanying text passages in this report cover the major type-of-structure categories within total U.S. put-in-place construction spending. A limited number of other sub-categories will see their construction activity levels, out to 2015, driven by technological, demographic, social and political forces that are evolving and setting their own paces.
Concerning ‘public safety’, current thinking leans towards lowering the nation’s notorious incarceration rate. In ‘communications’, the push will be towards implementation of broadband and 5G networks everywhere, including rural communities currently underserved in Internet access.
‘Conservation and development’ investment must inevitably be governed by the extent of drought, fire and storm damage that, while always being a feature of the landscape, is now apparently occurring more frequently and with more devastating consequences due to ‘climate change’.
‘Starts’ versus Put-in-place (PIP) Statistics
‘Starts’ compile the total estimated dollar value of all projects on which ground is broken in any given month. By way of contrast, put-in-place capital spending statistics are analogous to work-in-progress payments as the building of structures proceeds to completion.
Consider a $60 million office tower for which ground is broken in June 2021. For the ‘starts’ series, the entire estimated value ($60 million) will be entered in June 2021. In PIP numbers, it will be captured as spending of approximately $15 million in 2021; $25 million in 2022; and the final $20 million in 2023.
Table 1: U.S. Construction Spending (put-in-place investment)
(billions of “current” $s)
| Actuals | Forecasts | |||||||
| Type of Construction: | 2019 | 2020 | 2021 | 2022 | 2023 | 2024 | 2025 | |
| Grand Total | 1,365.0 | 1,429.6 | 1,574.8 | 1,703.0 | 1,844.1 | 1,948.1 | 2,026.5 | |
| (year vs previous year) | 2.3% | 4.7% | 10.2% | 8.1% | 8.3% | 5.6% | 4.0% | |
| Total Residential | 550.4 | 613.7 | 727.9 | 780.9 | 845.2 | 892.9 | 928.2 | |
| -2.5% | 11.5% | 18.6% | 7.3% | 8.2% | 5.6% | 4.0% | ||
| Total Non-residential | 814.6 | 815.9 | 846.9 | 922.1 | 998.9 | 1,055.3 | 1,098.2 | |
| 5.8% | 0.2% | 3.8% | 8.9% | 8.3% | 5.6% | 4.1% | ||
| Total Commercial/for Lease | 198.3 | 193.3 | 186.3 | 184.7 | 198.4 | 211.6 | 220.3 | |
| 1.9% | -2.5% | -3.6% | -0.8% | 7.4% | 6.6% | 4.1% | ||
| Lodging | 33.1 | 28.5 | 24.3 | 24.4 | 27.6 | 30.4 | 32.6 | |
| 5.1% | -13.8% | -14.9% | 0.4% | 13.4% | 9.9% | 7.2% | ||
| Office | 84.8 | 81.2 | 75.2 | 67.2 | 67.3 | 69.9 | 72.2 | |
| 10.7% | -4.2% | -7.4% | -10.6% | 0.1% | 3.9% | 3.3% | ||
| Commercial (retail/warehouse) | 80.5 | 83.6 | 86.8 | 93.2 | 103.6 | 111.3 | 115.6 | |
| -7.1% | 3.9% | 3.9% | 7.3% | 11.1% | 7.5% | 3.8% | ||
| Total Institutional | 193.9 | 197.3 | 205.0 | 219.8 | 233.7 | 242.7 | 248.5 | |
| 4.4% | 1.7% | 3.9% | 7.2% | 6.3% | 3.9% | 2.4% | ||
| Health Care | 45.6 | 47.4 | 52.9 | 57.0 | 60.9 | 63.9 | 65.5 | |
| 4.8% | 4.2% | 11.5% | 7.7% | 6.8% | 4.9% | 2.6% | ||
| Educational | 105.5 | 104.8 | 108.2 | 114.2 | 121.6 | 125.4 | 127.6 | |
| 4.0% | -0.7% | 3.3% | 5.6% | 6.4% | 3.1% | 1.8% | ||
| Religious | 3.6 | 3.2 | 3.6 | 3.7 | 3.6 | 3.6 | 3.7 | |
| 1.3% | -11.1% | 13.0% | 4.3% | -3.4% | -0.2% | 2.7% | ||
| Public Safety | 10.5 | 15.0 | 14.2 | 15.9 | 17.6 | 18.3 | 18.3 | |
| 12.0% | 43.1% | -5.7% | 12.2% | 10.7% | 3.9% | 0.3% | ||
| Amusement and Recreation | 28.8 | 26.9 | 26.2 | 29.0 | 30.1 | 31.7 | 33.3 | |
| 2.9% | -6.7% | -2.7% | 10.7% | 3.7% | 5.3% | 5.3% | ||
| Total Engineering/Civil | 342.3 | 353.3 | 386.2 | 448.2 | 489.5 | 518.4 | 542.5 | |
| (year vs previous year) | 8.1% | 3.2% | 9.3% | 16.1% | 9.2% | 5.9% | 4.7% | |
| Transportation | 57.2 | 56.8 | 65.3 | 77.8 | 87.7 | 94.0 | 97.9 | |
| 7.6% | -0.7% | 15.1% | 19.1% | 12.7% | 7.2% | 4.1% | ||
| Communication | 22.3 | 22.7 | 25.0 | 27.1 | 28.8 | 30.6 | 32.5 | |
| -9.4% | 1.8% | 10.3% | 8.4% | 6.2% | 6.5% | 6.2% | ||
| Power | 113.7 | 119.4 | 137.4 | 171.1 | 183.8 | 191.9 | 200.7 | |
| 13.9% | 5.0% | 15.1% | 24.5% | 7.4% | 4.4% | 4.5% | ||
| Highway and Street | 98.1 | 100.9 | 104.0 | 110.4 | 119.0 | 127.2 | 134.0 | |
| 7.3% | 2.8% | 3.1% | 6.2% | 7.8% | 6.9% | 5.4% | ||
| Sewage/Waste Disposal & Water Supply | 41.9 | 45.1 | 46.7 | 52.5 | 59.0 | 62.2 | 64.7 | |
| 6.0% | 7.8% | 3.5% | 12.4% | 12.5% | 5.4% | 4.0% | ||
| Conservation and Development | 9.1 | 8.4 | 7.8 | 9.3 | 11.2 | 12.4 | 12.8 | |
| 11.1% | -7.6% | -7.5% | 19.1% | 20.8% | 10.4% | 3.0% | ||
| Total Industrial/Manufacturing | 80.1 | 72.0 | 69.4 | 69.4 | 77.2 | 82.5 | 86.9 | |
| 10.6% | -10.1% | -3.6% | -0.1% | 11.4% | 6.8% | 5.3% | ||
"Current" means not adjusted for inflation.
Source of actuals: U.S. Census Bureau / Forecasts: Oxford Economics and ConstructConnect.
Table: ConstructConnect.
Put-in-place (PIP) Investment
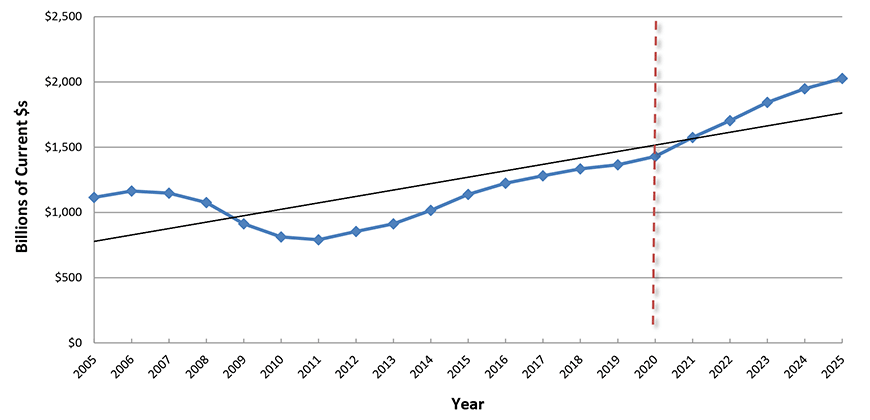
Chart: ConstructConnect.
Residential
After sitting below long-term trend for a decade, residential PIP construction (including a great deal of renovation as well as new work), is speeding up again. Backing is coming from an urban to suburban shift and millennial generation demands for single-family homes. The low interest rate stimulus may prove short-lived.
Put-in-place (PIP) Investment
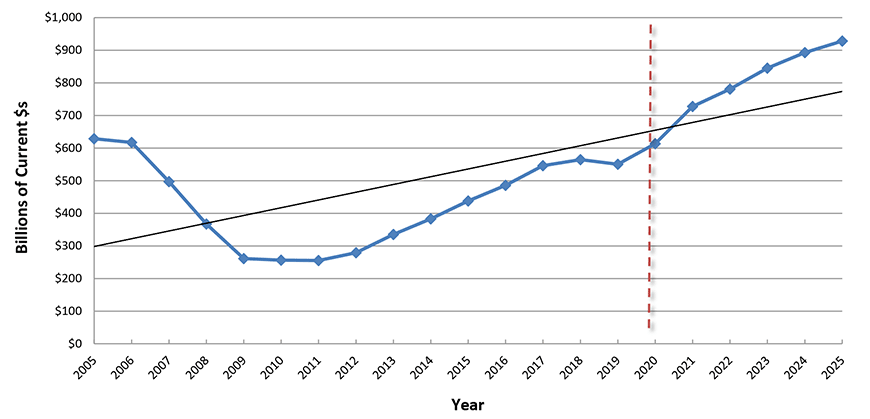
Chart: ConstructConnect.
Lodging
Among type-of-structure categories, hotel and motel construction displays perhaps the most pronounced cyclical pattern. The huge job losses in the accommodation and travel sectors last year knocked the stuffing out of lodging investment. A significant recovery probably shouldn’t be expected before 2023.
Put-in-place (PIP) Investment
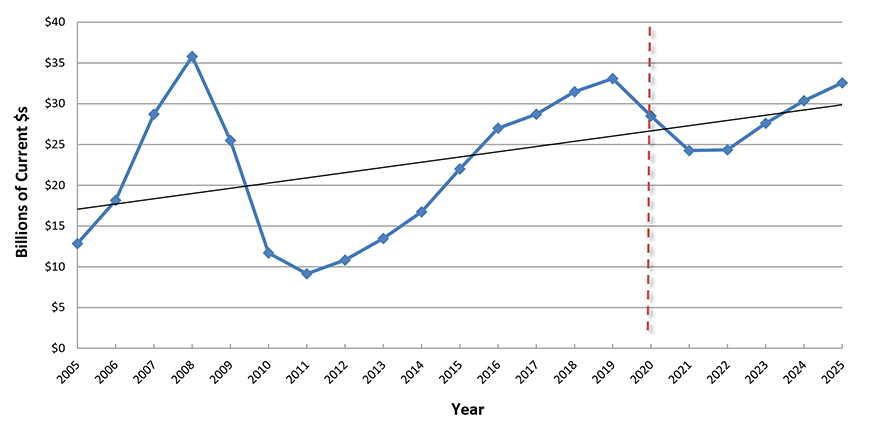
Chart: ConstructConnect.
Office Buildings
The pendulum on office space occupancy has swung wildly towards high vacancy rates as a result of the coronavirus health crisis and stay at home guidance. Many employees have grown to like their new lifestyles. But with the pandemic receding, will employers accommodate more flexible schedules? Caution concerning office construction is warranted.
Put-in-place (PIP) Investment
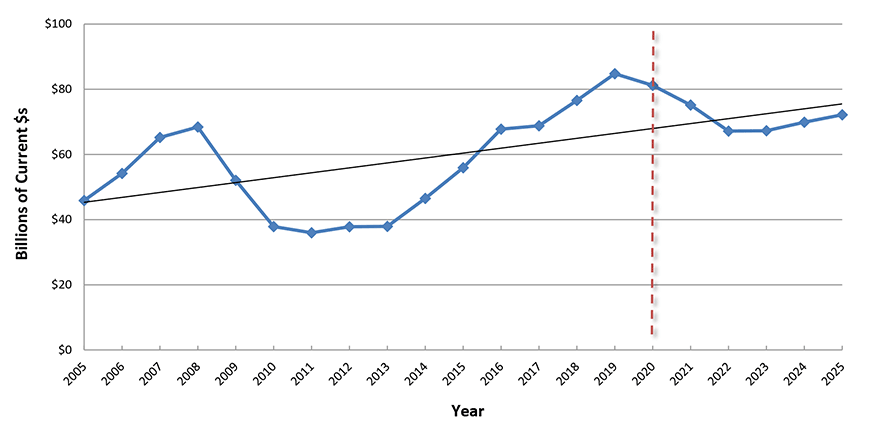
Chart: ConstructConnect.
Retail, Warehouse, Restaurant
Shopping online has been the clearest winner among all economic activities since the beginning of the pandemic. The big tech companies generating the most revenue through Internet platforms have been proceeding with mega-sized, by square footage, fulfilment and distribution centers. More such investment will include drone and AV delivery systems.
Put-in-place (PIP) Investment
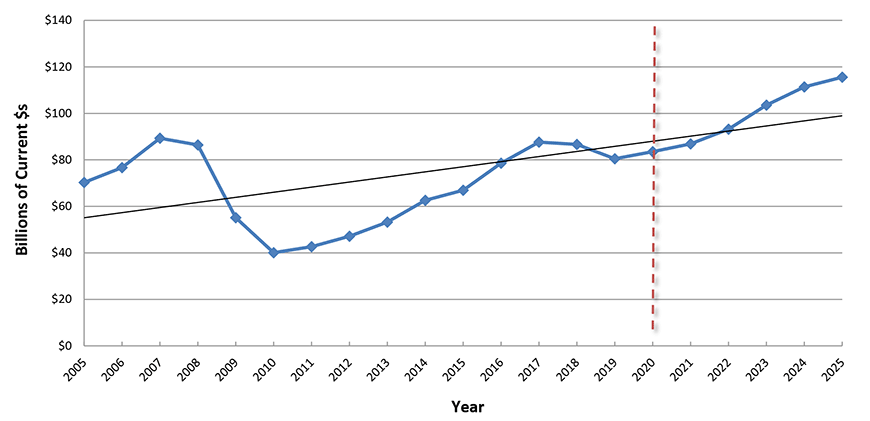
Chart: ConstructConnect.
Health Care
With fewer beds needed for COVID-19 care, hospitals can go back to making money the old-fashioned way, through charging patients and insurance companies for standard procedures. Also, the security of vaccination coverage will lead to more traffic on the doorsteps of medical clinics. Plus, an overriding consideration for health care investment is the aging population.
Put-in-place (PIP) Investment
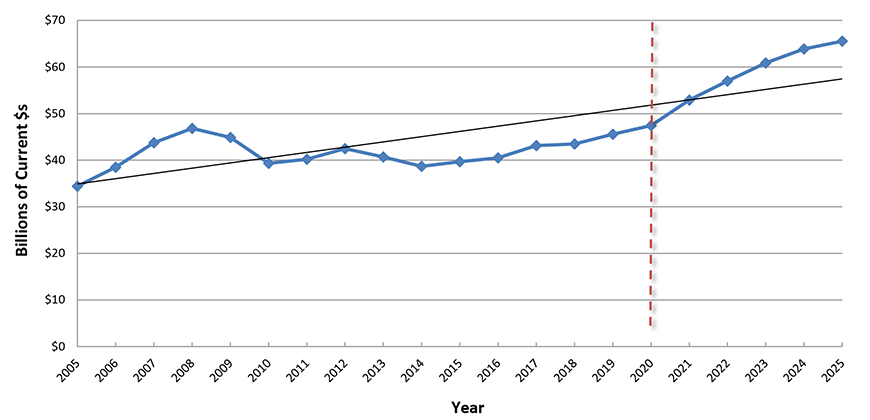
Chart: ConstructConnect.
Educational
Learning from home has proven possible, but often not desirable. The absence of personal contact has been a drawback. Low foreign enrolments and fewer births are decreasing counts at both ends of the student age spectrum. However, school investment will benefit from HVAC upgrades for safety and health reasons and from more business research arrangements.
Put-in-place (PIP) Investment
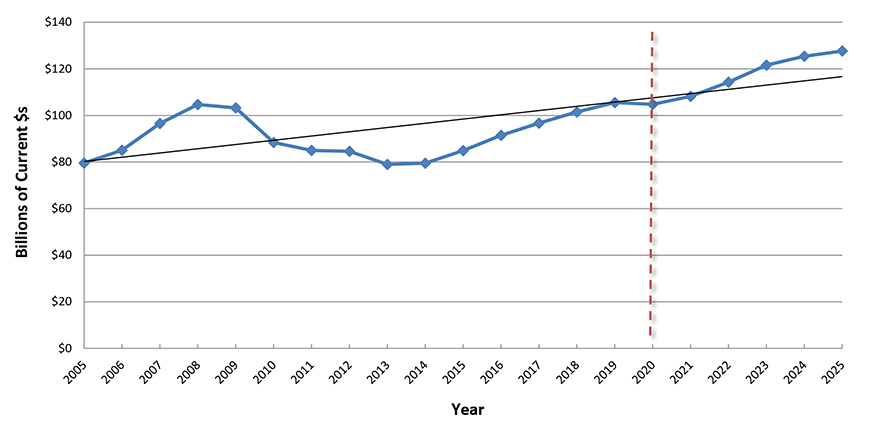
Chart: ConstructConnect.
Amusement and Recreation
A year spent away from amusement parks, sports stadiums/arenas and Broadway theater, for that matter, has given many people an even greater appreciation of live events. The competition to attract spectators through turnstiles was fierce before Spring, 2020 and it’s sure to intensify once again, implying substantial investments in new venues with accompanying high-tech ‘gear’.
Put-in-place (PIP) Investment
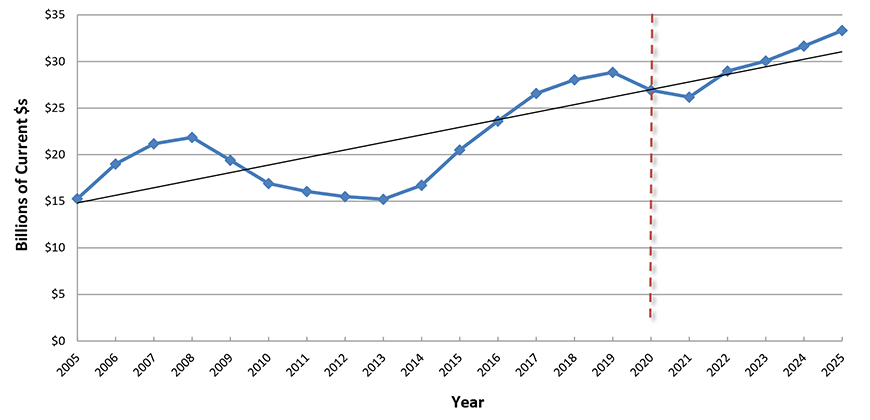
Chart: ConstructConnect.
Transportation
Pre-pandemic upcoming projects lists were overflowing with international airport expansions and new rapid transit lines. The pandemic put a halt to many of these proposals, as the number of flights dried to a trickle and worker bees ceased commuting. New capital spending in these areas will be entirely determined by the degree to which moving about returns to ‘normal’.
Put-in-place (PIP) Investment
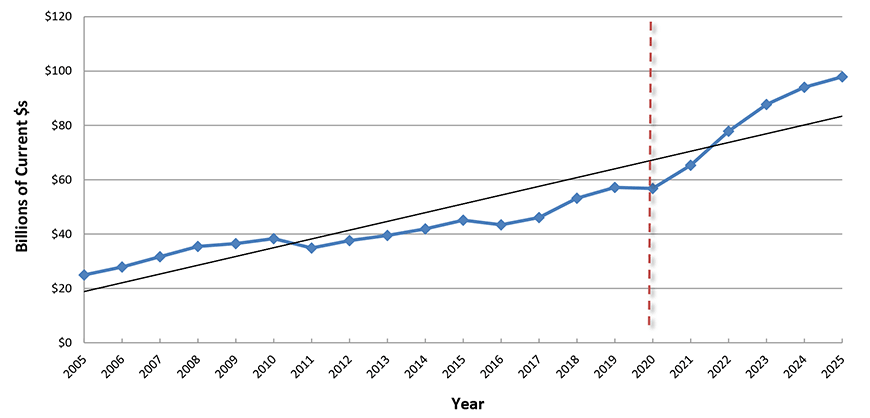
Chart: ConstructConnect.
Power
The Biden Administration has delivered two messages concerning energy investment: (1) proposals for additional major oil and gas pipeline facilities likely will not be met favorably; and (2) attention should be directed away from fossil fuel development, focusing instead on carbon-free solar and wind power generation. Full-on electrification of the economy is the goal.
Put-in-place (PIP) Investment
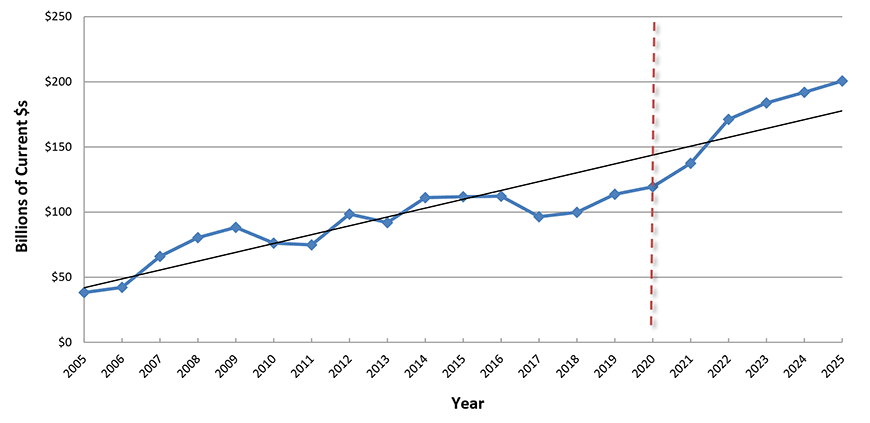
Chart: ConstructConnect.
Highways and Streets
PIP spending on highways and streets in America is the most consistent of all construction sub-categories. Amplitudes from year to year are muted. Nationally, a long-term gradually ascending growth path is almost magically adhered to, despite continual worries about financing. Moving forward, a greater emphasis on infrastructure improvement will help the roadbuilding sector.
Put-in-place (PIP) Investment
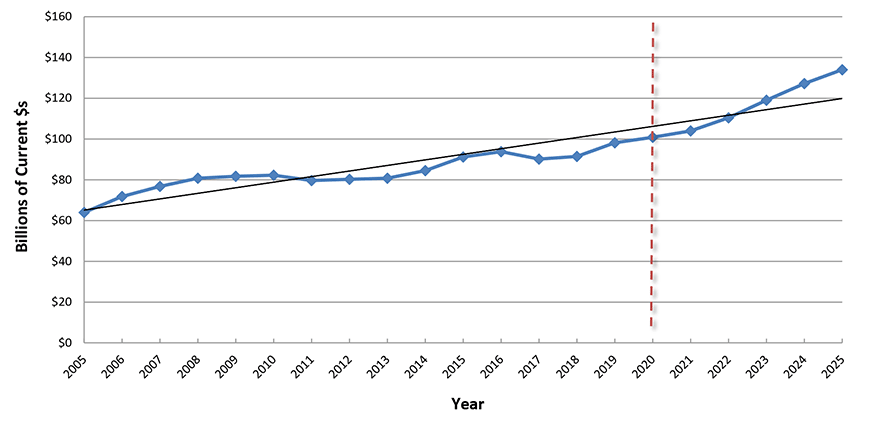
Chart: ConstructConnect.
Water Supply; Sewage and Waste Disposal
Undersupply of water delivery and waste takeaway projects has been prevalent for years, with capital spending essentially flat from 2006 through 2019. Aging existing assets, plus new capacity requirements necessitated by today’s single-family homebuilding surge point to a positive turnaround in water and waste-related utility construction out to 2015 at a minimum.
Put-in-place (PIP) Investment
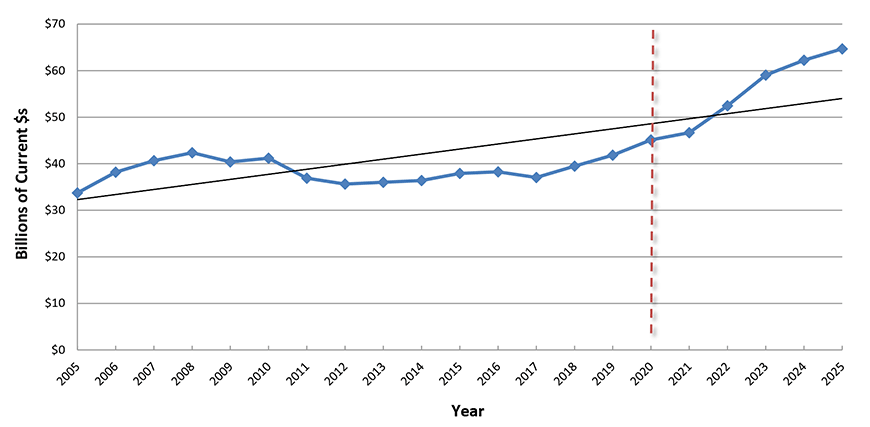
Chart: ConstructConnect.
Manufacturing
U.S. ‘plant’ PIP investment reached a peak in 2015 that has not been matched since, although a noble try, grounded in large petrochemical and LNG projects, was made in 2019. Forces are coming into play, though, including deglobalization, the USMCA Agreement, auto making changeovers to embrace electric, that will enlarge the footprints of domestic manufacturers.
Put-in-place (PIP) Investment
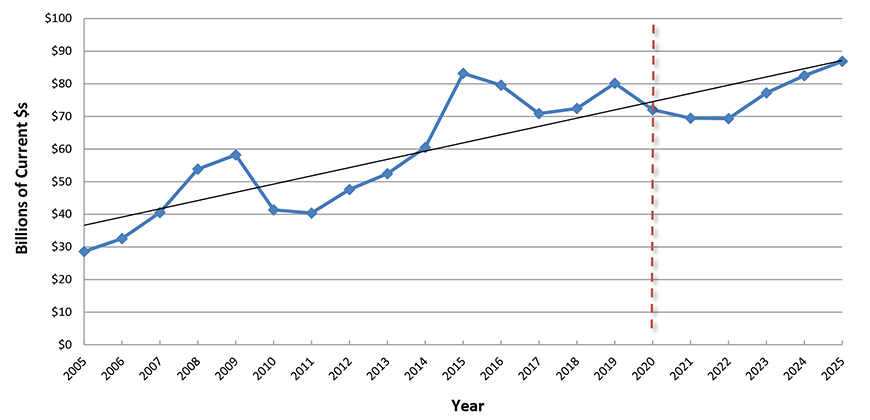
Chart: ConstructConnect.
Alex Carrick is Chief Economist for ConstructConnect. He has delivered presentations throughout North America on the U.S., Canadian and world construction outlooks. Mr. Carrick has been with the company since 1985. Links to his numerous articles are featured on Twitter @ConstructConnx, which has 50,000 followers.


Recent Comments
comments for this post are closed