
June was an excellent month for overall net jobs creation in the U.S., according to the Bureau of Labor Statistics (BLS). Total employment in the nation rose by +850,000 positions.

The construction sector, however, was left out of the bonanza. Staffing among the ‘hard hat’ contingent contracted by -7,000 jobs. The major plus and minus employment shifts within construction occurred with residential specialty contractors (i.e., sub-contractors), +13,000 jobs; nonresidential specialty contractors, -15,000 jobs; and heavy and civil general contractors, -11,000 jobs.
The U.S. seasonally adjusted (SA) unemployment rate economy-wide now stands at 5.9% compared with 11.1% in June of last year. Not seasonally adjusted (NSA) ‘U’ is currently 6.1% versus 11.2% a year ago. Construction’s NSA unemployment rate is presently 7.5%, whereas it had been 10.1% 12 months ago.
June marks the first month in a while that year-over-year compensation rates in construction weren’t markedly different than for all jobs. Throughout last year, the y/y earnings of construction workers trailed ‘all jobs’ pay checks, sometimes by considerable margins.
In June, however, while year-over-year ‘all jobs’ earnings were +3.6% hourly and +3.9% weekly, workers in construction were receiving close to the same, +3.9% hourly and +3.4% weekly.
Where did the big jumps in jobs in June occur? Manufacturing added +15,000; retail trade, +67,000; ‘professional and business services’, +72,000; education, +39,000; and ‘social assistance’, +32,000.
Government employment climbed by +188,000, mostly at the local level, +124,000, although the states also signed on more staff, +69,000. The federal government cut personnel, -5,000.
One Sector Accounted for 40% of Total Jobs Climb
I’ve left the best news for deep into this report, though. The jobs count in the ‘leisure and hospitality’ sector in the latest month soared by +343,000, accounting for 40% of the nation’s +850,000 total jobs expansion.
The ‘leisure and hospitality’ NSA unemployment rate has corrected to 10.9%, nearly two-thirds lower than June 2020’s 28.8%.
The sector that suffered the most as the result of holds being placed on sporting events, concerts and the like, with stay-at-home directives in place during the pandemic, is back off life support.
The +343,000 jobs figure for ‘leisure and hospitality’ in June came mainly in ‘accommodation and food services’, +269,000. In turn, the ‘accommodation and food services’ employment increase was made up of +75,000 jobs in hotels/motels and +194,000 in bars and restaurants.
Returning to construction to close this article, Table 1 shows the latest (May 2021) put-in-place capital spending figures calculated and published by the Census Bureau.
What’s most astonishing is the difference between how residential construction is performing versus nonresidential. The former has generated a +23.4% increase in dollar volume year to date in 2021 compared with January-May of 2020. Nonresidential work, however, has pulled back by -8.6%.
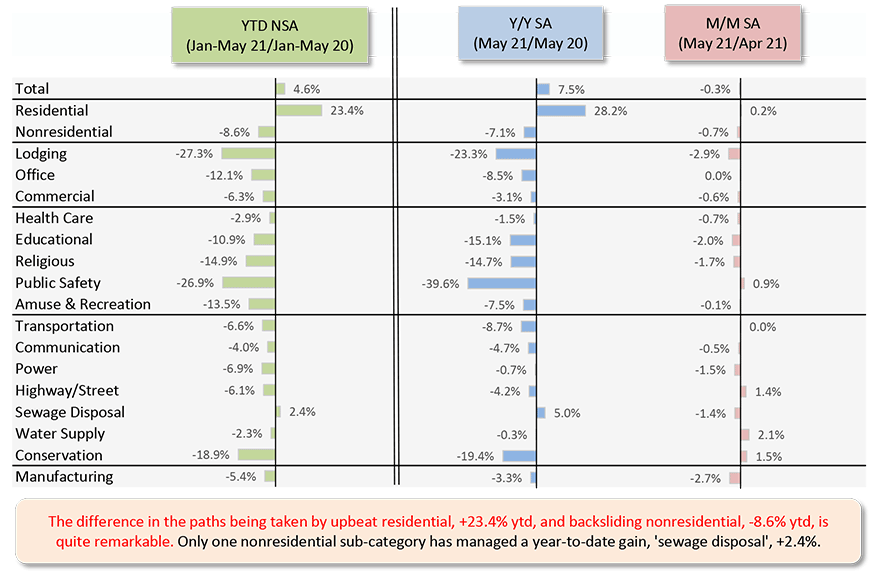
Table: ConstructConnect.
Table 2: Monitoring the U.S. Employment Recovery – June 2021
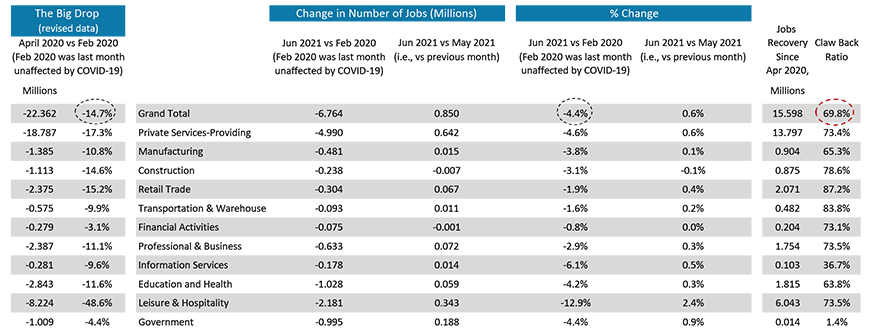
Chart: ConstructConnect.
Graph 1: U.S.: Month-to-month Total Jobs Creation
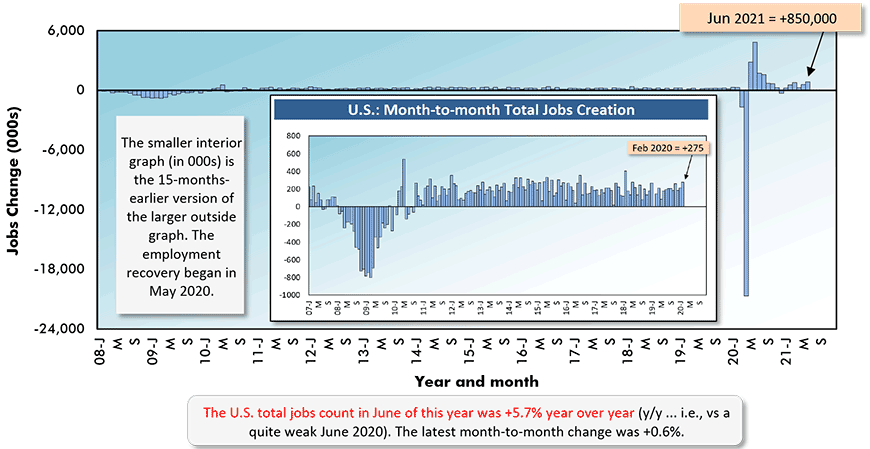
Chart: ConstructConnect.
Graph 2: U.S. Employment: Total
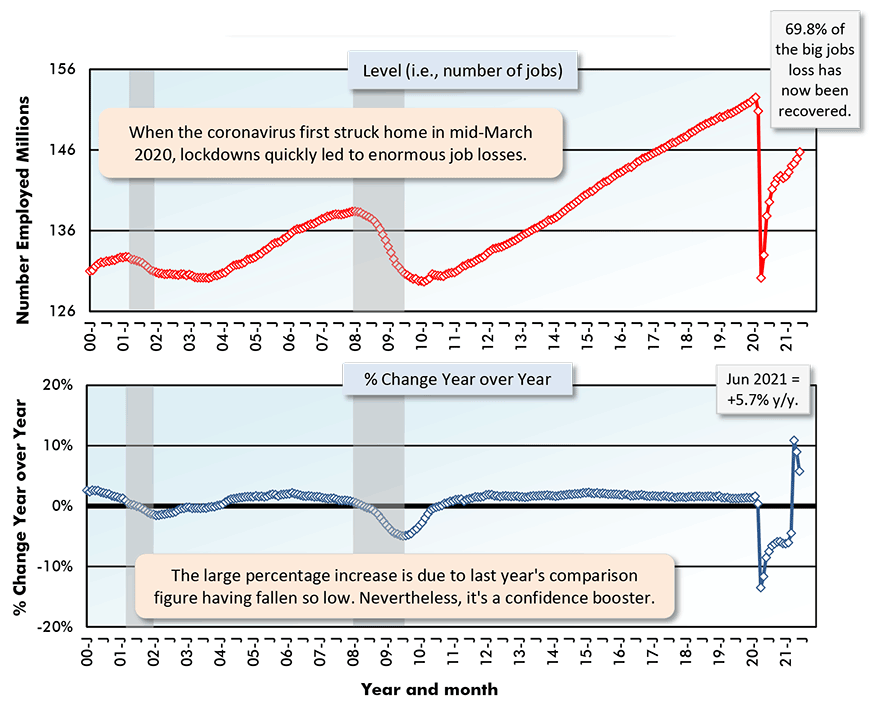
Latest data points are for June, 2021 / Based on seasonally adjusted (SA) data.
Chart: ConstructConnect.
Graph 3: U.S. Employment: Construction
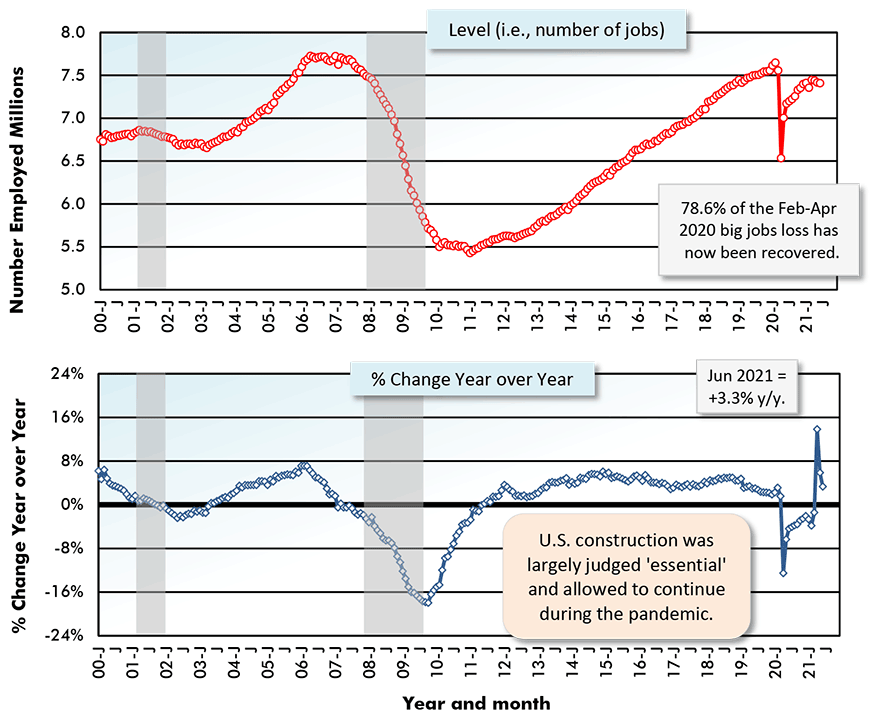
Latest data points are for June, 2021 / Based on seasonally adjusted (SA) data.
Chart: ConstructConnect.
Graph 4: Change in Level of U.S. Construction Employment, Month to Month (M/M) −
Total & by Categories – June 2021
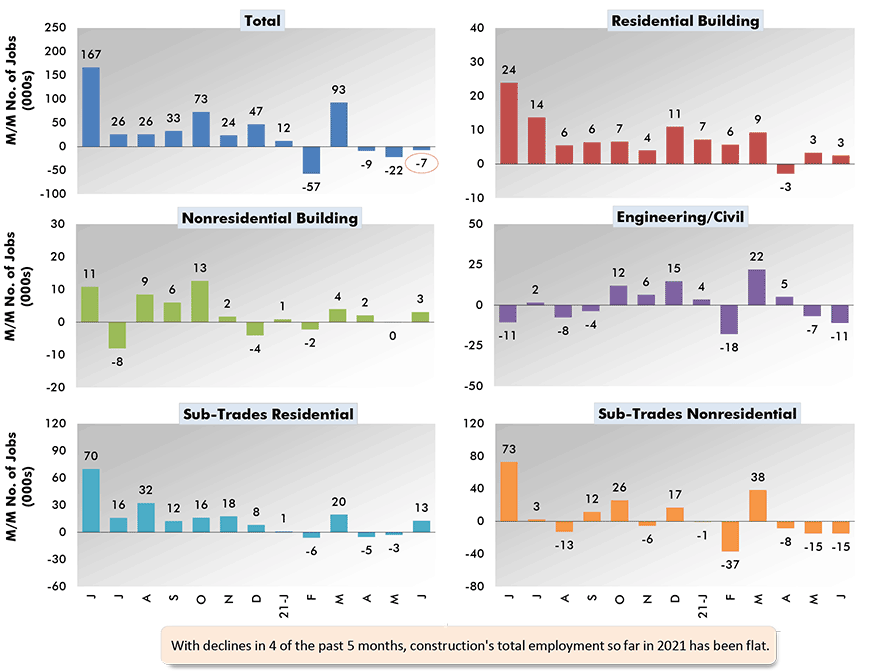
Chart: ConstructConnect.
Graph 5: U.S. Manufacturing vs Construction Employment –
June 2021 – Seasonally Adjusted (SA) Payroll Data
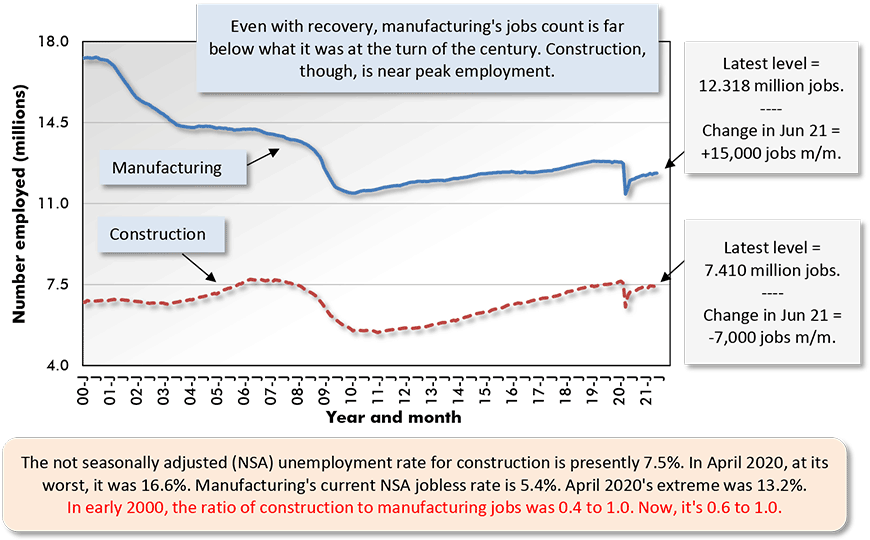
Chart: ConstructConnect.
Graph 6: Y/Y Jobs Change, U.S. Total Industry & Major Subsectors − June 2021
(based on seasonally adjusted payroll data)
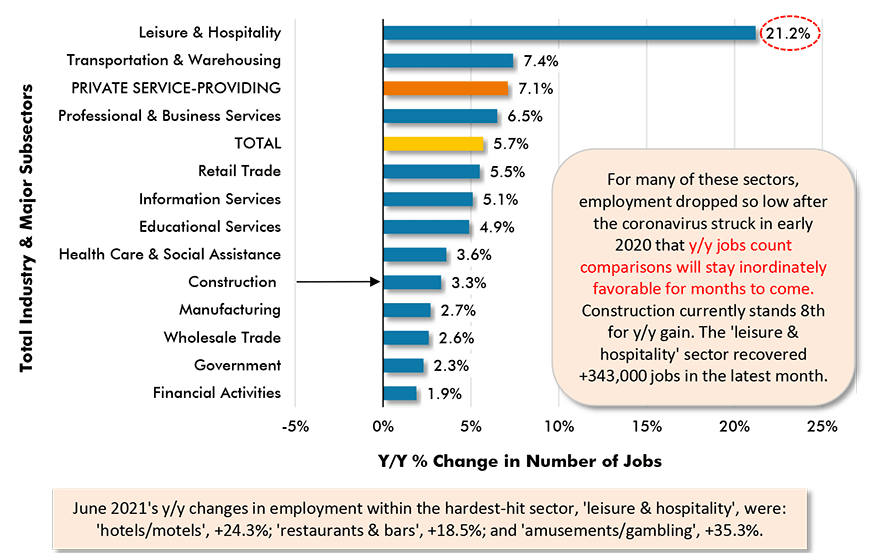
Chart: ConstructConnect.
Please click on the following link to download the PDF version of this article:
Economy at a Glance Vol. 17, Issue 102 – Construction Left Out of June’s U.S. Big Jobs Advance – PDF
Alex Carrick is Chief Economist for ConstructConnect. He has delivered presentations throughout North America on the U.S., Canadian and world construction outlooks. Mr. Carrick has been with the company since 1985. Links to his numerous articles are featured on Twitter @ConstructConnx, which has 50,000 followers.


Recent Comments
comments for this post are closed