This article focuses on the latest U.S. building material cost increases as laid out in the Producer Price Index (PPI) data set compiled and published by the Bureau of Labor Statistics (BLS).

The PPI series measures prices for goods ‘as they leave the factory gate’. They’re not necessarily as up-to-the-minute relevant as some other measures. For example, there have been sighs of relief in the marketplace because of recent perceived price softening in the forestry sector. The moderation relates to transactions on commodity exchanges covering ‘spot’ and ‘futures’ prices.
Therefore, some easing may be imminent, and again especially relating to lumber and its byproducts, but there are still numerous cost hikes among other construction material inputs to raise an eyebrow or two.
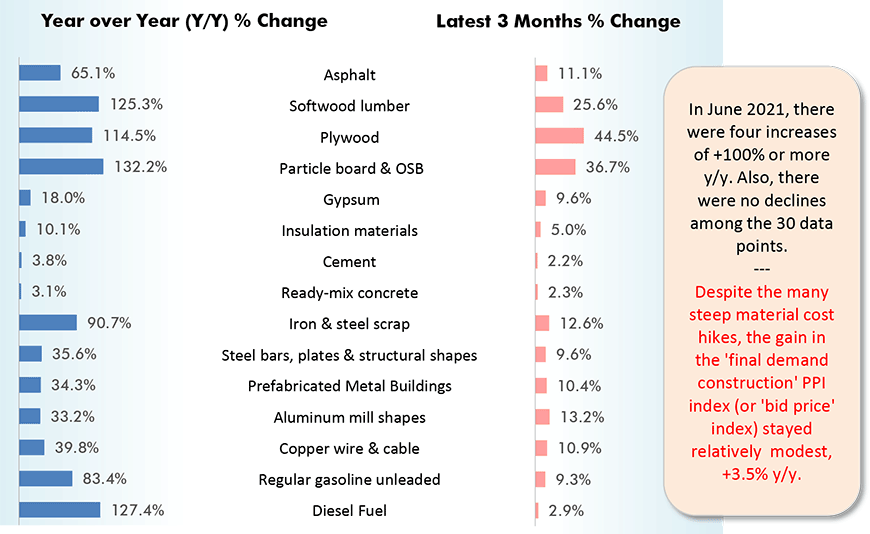
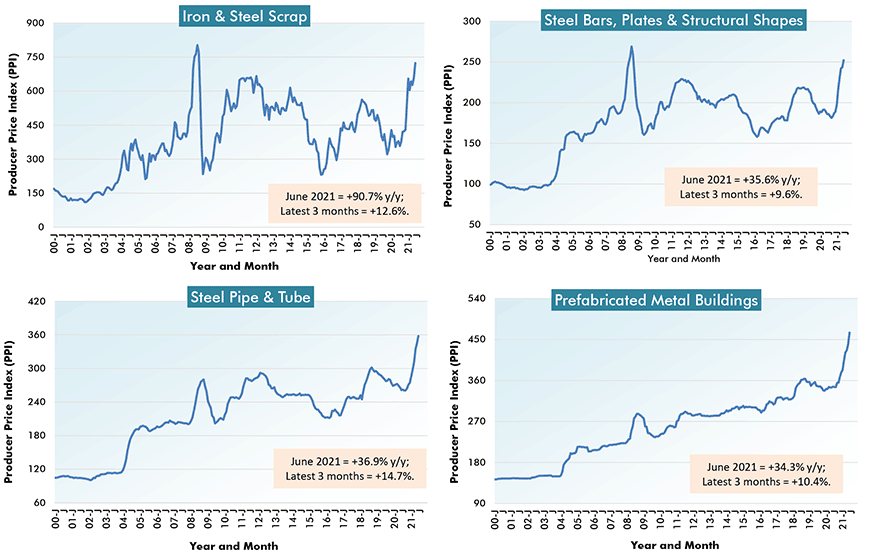
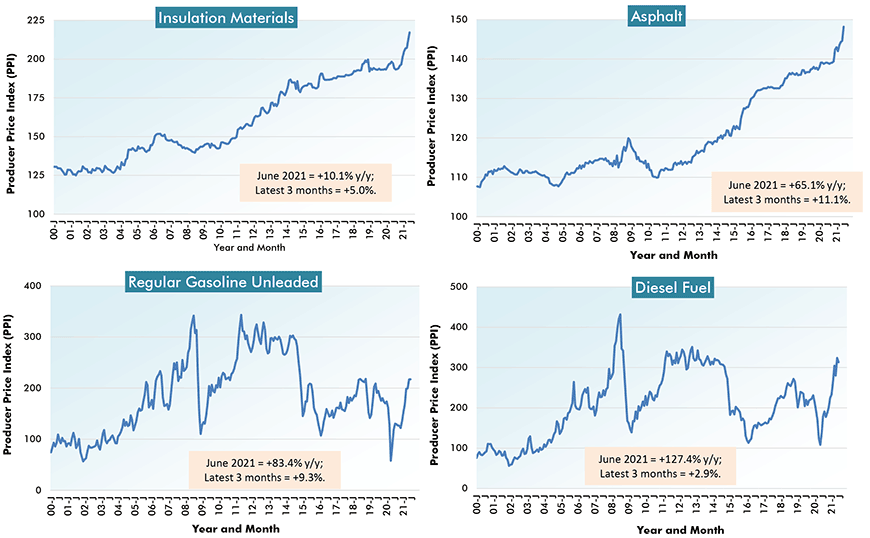
Prices for steel, aluminum and copper products, along with gasoline and diesel fuel, have all been climbing significantly higher, to some extent under the cover of the more attention-grabbing advances in forestry products.
In any event, Graph 1 shows the dilemma faced by contractors. In hopes of being awarded work, they’ve been keeping their bid prices low, while their expenses have been increasing alarmingly.
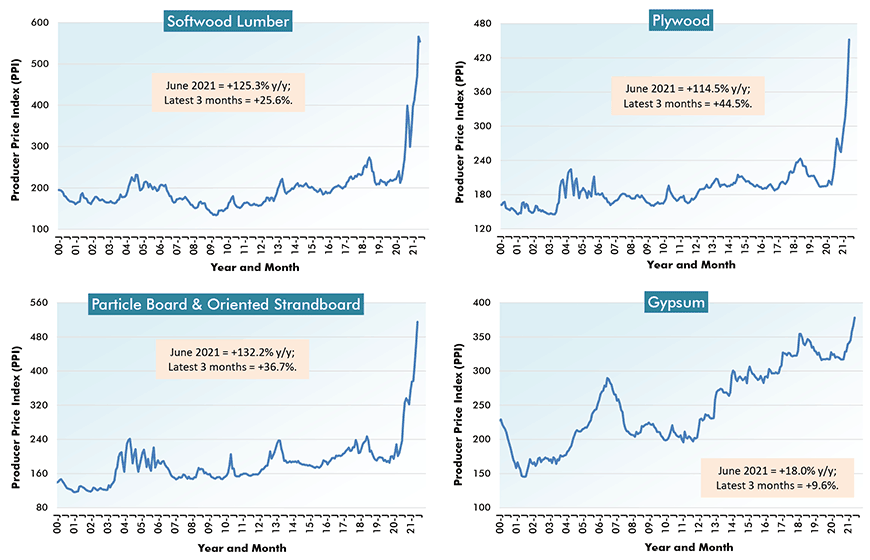
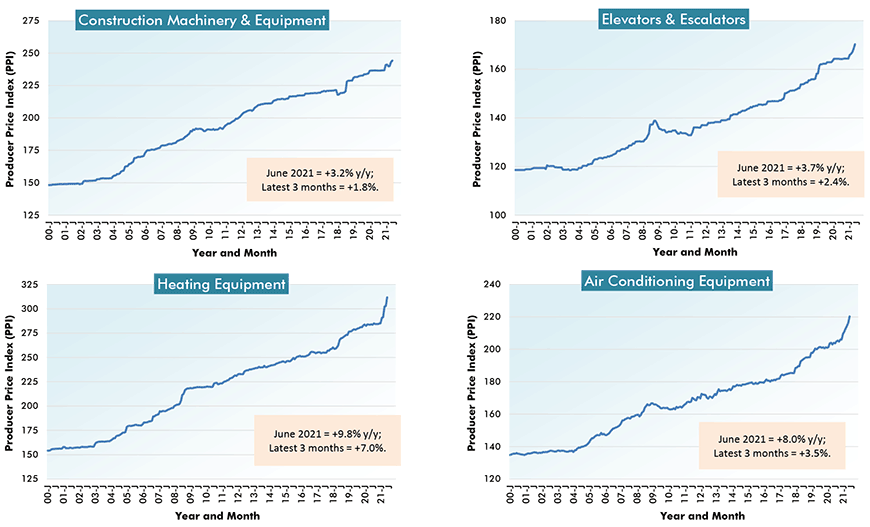
Appearing below are 30 graphs and a detailed table. 28 of the graphs are in clusters of four each. The graphs and table feature latest monthly updates of what has appeared before at ConstructConnect’s website.
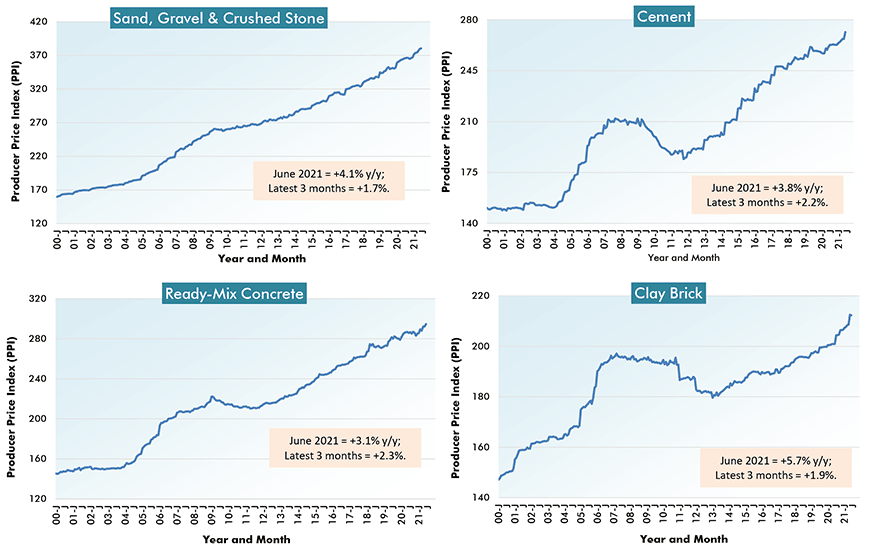
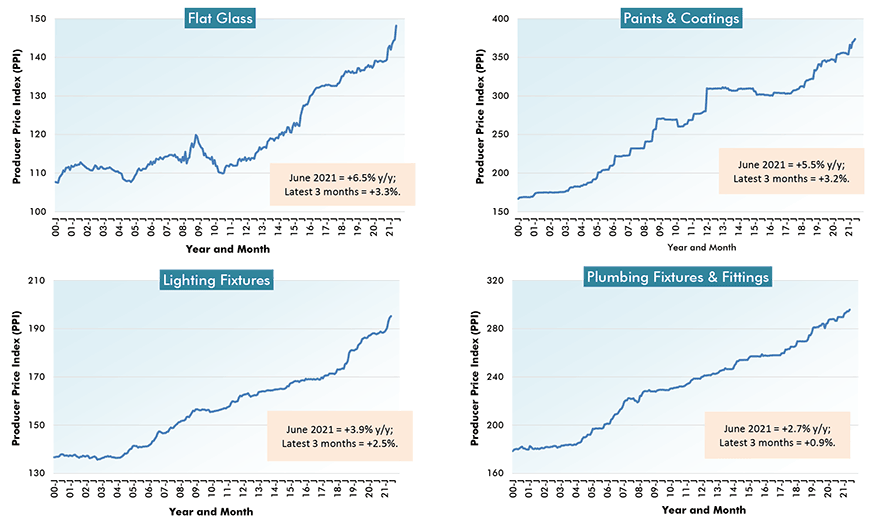
Recently, many of the slopes in the cluster graphs have taken on a steepness rarely, if ever, seen before.
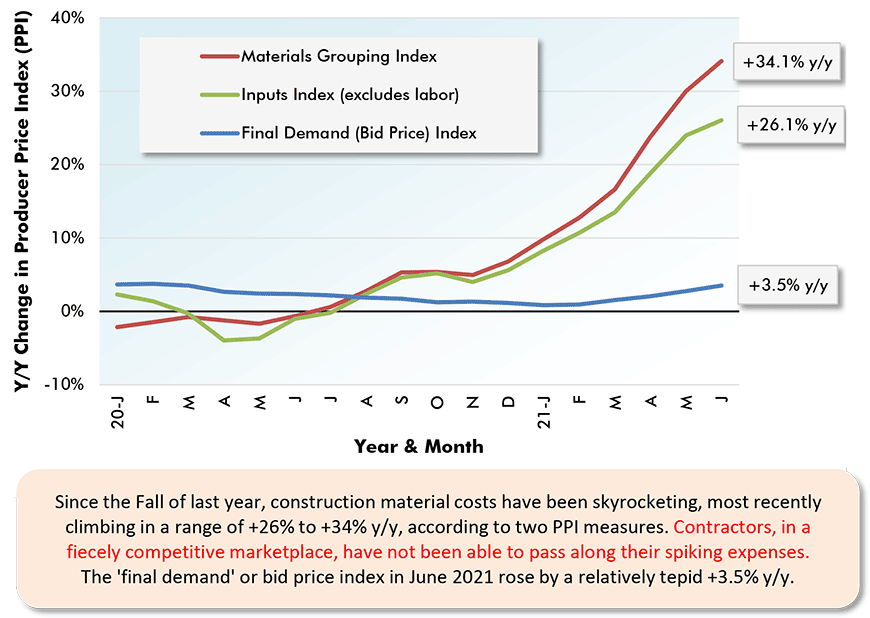
Chart: ConstructConnect.
From Producer Price Index (PPI) Series – June 2021
Charts: ConstructConnect.
Charts: ConstructConnect.
Charts: ConstructConnect.
Charts: ConstructConnect.

Charts: ConstructConnect.
Charts: ConstructConnect.
Charts: ConstructConnect.
Charts: ConstructConnect.
% Change in the April 2021 Index from:
| 3 Years | 1 Year | 6 months | 3 months | 1 month | |||||
| Ago | Ago | Ago | Ago | Ago | |||||
| Final Demand/Service/Commodity/Energy/Input: | |||||||||
| Final Demand Construction | 11.6% | 3.5% | 3.3% | 2.4% | 0.7% | ||||
| New warehouse building construction | 11.0% | 4.0% | 3.8% | 3.6% | 0.7% | ||||
| New school building construction | 10.9% | 1.5% | 1.6% | 1.1% | 0.1% | ||||
| New office building construction | 12.6% | 5.1% | 4.6% | 1.9% | 0.5% | ||||
| New industrial building construction | 12.0% | 2.1% | 1.4% | 1.1% | 0.3% | ||||
| New health care building construction | 11.9% | 4.0% | 4.4% | 4.1% | 0.9% | ||||
| Architectural & engineering services | 5.6% | 3.2% | 1.5% | 0.6% | 0.1% | ||||
| Construction machinery & equipment | 11.2% | 3.2% | 3.1% | 1.8% | 0.4% | ||||
| Asphalt | 2.6% | 65.1% | 58.1% | 11.1% | 10.9% | ||||
| Plastic construction products | 23.5% | 21.8% | 15.9% | 9.5% | 3.1% | ||||
| Softwood lumber | 102.4% | 125.3% | 62.7% | 25.6% | -2.1% | ||||
| Hardwood lumber | 17.6% | 37.4% | 24.6% | 7.5% | 0.0% | ||||
| Millwork | 26.0% | 23.0% | 15.1% | 9.9% | 3.0% | ||||
| Plywood | 85.9% | 114.5% | 77.4% | 44.5% | 15.2% | ||||
| Particle board & oriented strandboard (OSB) | 108.6% | 132.2% | 59.9% | 36.7% | 11.7% | ||||
| Gypsum | 11.9% | 18.0% | 15.1% | 9.6% | 3.3% | ||||
| Insulation materials | 12.8% | 10.1% | 10.5% | 5.0% | 2.4% | ||||
| Construction sand, gravel & crushed stone | 13.3% | 4.1% | 3.7% | 1.7% | 0.2% | ||||
| Cement | 6.8% | 3.8% | 3.3% | 2.2% | 1.8% | ||||
| Ready-mix concrete | 8.3% | 3.1% | 3.4% | 2.3% | 0.8% | ||||
| Precast concrete products | 15.8% | 7.7% | 6.0% | 3.8% | 0.2% | ||||
| Prestressed concrete products | 13.4% | 8.6% | 11.8% | 9.2% | 6.7% | ||||
| Brick (clay) | 8.4% | 5.7% | 2.8% | 1.9% | -0.1% | ||||
| Coal | -3.4% | 1.3% | 2.8% | 1.9% | 0.3% | ||||
| Iron ore | 11.1% | 10.2% | 5.1% | 4.2% | 3.5% | ||||
| Iron & steel scrap | 32.0% | 90.7% | 35.0% | 12.6% | 9.9% | ||||
| Steel bars, plates & structural shapes | 20.0% | 35.6% | 33.6% | 9.6% | 3.5% | ||||
| Steel pipe & tube | 26.0% | 36.9% | 30.6% | 14.7% | 4.0% | ||||
| Fabricated structural metal products | 26.9% | 25.0% | 23.1% | 14.0% | 5.7% | ||||
| Prefabricated Metal Buildings | 31.1% | 34.3% | 23.0% | 10.4% | 6.0% | ||||
| Aluminum mill shapes | 5.2% | 33.2% | 19.8% | 13.2% | 2.5% | ||||
| Flat glass | 8.6% | 6.5% | 4.1% | 3.3% | 2.5% | ||||
| Paints, architectural coatings | 16.7% | 5.5% | 5.5% | 3.2% | 0.7% | ||||
| Lighting fixtures | 12.6% | 3.9% | 3.6% | 2.5% | 0.3% | ||||
| Plumbing fixtures & fittings | 9.7% | 2.7% | 2.1% | 0.9% | 0.5% | ||||
| Elevators & escalators | 10.2% | 3.7% | 3.6% | 2.4% | 1.1% | ||||
| Heating equipment | 16.5% | 9.8% | 9.5% | 7.0% | 3.0% | ||||
| Air conditioning equipment | 14.0% | 8.0% | 6.9% | 3.5% | 1.8% | ||||
| Copper wire & cable | 27.4% | 39.8% | 19.3% | 10.9% | 1.8% | ||||
| Regular gasoline unleaded | -0.3% | 83.4% | 60.4% | 9.3% | 0.0% | ||||
| Diesel Fuel | 19.9% | 127.4% | 39.5% | 2.9% | -3.3% | ||||
| Inputs to new construction | 24.7% | 26.1% | 18.0% | 10.5% | 3.8% | ||||
| Inputs to new residential construction | 27.5% | 28.3% | 20.0% | 12.1% | 4.5% | ||||
| Inputs to new non-res construction | 21.8% | 23.5% | 16.1% | 8.9% | 3.1% | ||||
| Inputs to commercial construction | 21.0% | 22.3% | 15.2% | 8.8% | 3.1% | ||||
| Inputs to healthcare structures | 22.1% | 22.8% | 15.5% | 9.0% | 3.2% | ||||
| Inputs to industrial structures | 21.4% | 19.7% | 13.2% | 7.5% | 2.9% | ||||
| Inputs to highways & streets | 17.4% | 21.6% | 15.4% | 8.3% | 2.9% | ||||
| Inputs to power & communication structures | 20.9% | 24.3% | 16.9% | 9.4% | 3.1% | ||||
| Inputs to educational & vocational structures | 23.7% | 23.8% | 15.9% | 9.3% | 3.1% | ||||
| Construction materials (PPI ‘Special Index’) | 31.6% | 34.1% | 27.0% | 14.3% | 3.8% |
The ‘service’, ‘commodity’ and ‘energy’ indices (in the middle section of the table) are based on ‘factory-gate’ sales prices.
The ‘input’ indices (at bottom) reflect costs faced by contractors. They exclude capital investment (i.e., machinery & equipment), labor & imports.
The ‘input’ indices are built up from the ‘service’ (design, legal, transport & warehousing, etc.) ‘commodity’ and ‘energy’ indices.
Table: ConstructConnect.
Please click on the following link to download the PDF version of this article:
Economy at a Glance Vol. 17, Issues 110 and 111 – PPI Measures of Construction Material Costs are Still Shouting Warnings – PDF
Alex Carrick is Chief Economist for ConstructConnect. He has delivered presentations throughout North America on the U.S., Canadian and world construction outlooks. Mr. Carrick has been with the company since 1985. Links to his numerous articles are featured on Twitter @ConstructConnx, which has 50,000 followers.


Recent Comments
comments for this post are closed